
Compare Shilpa Medicare with Similar Stocks
Dashboard
Weak Long Term Fundamental Strength with an average Return on Capital Employed (ROCE) of 5.44%
- Poor long term growth as Net Sales has grown by an annual rate of 11.30% and Operating profit at 19.78% over the last 5 years
With a growth in Net Profit of 99.09%, the company declared Very Positive results in Mar 26
With ROCE of 9.8, it has a Expensive valuation with a 3.7 Enterprise value to Capital Employed
Majority shareholders : Non Institution
Consistent Returns over the last 3 years
Stock DNA
Pharmaceuticals & Biotechnology
INR 11,183 Cr (Small Cap)
49.00
35
0.09%
0.24
8.89%
4.37
Total Returns (Price + Dividend) 
Latest dividend: 0.5 per share ex-dividend date: Sep-17-2025
Risk Adjusted Returns v/s
Returns Beta

News
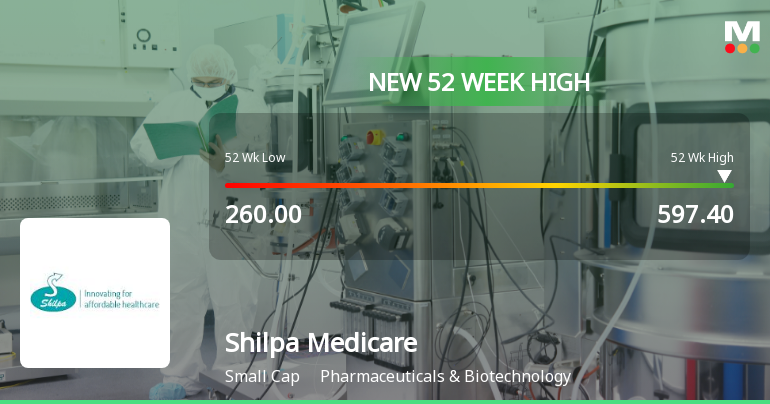
Broad-Based Technical Strength Lifts Shilpa Medicare Ltd to 52-Week High of Rs 597.4
With a decisive surge to Rs 597.4 on 23 Jun 2026, Shilpa Medicare Ltd has reached a fresh 52-week high, marking a 33.42% gain over the past year and significantly outperforming the Sensex, which declined 6.92% in the same period. This milestone comes amid a complex market backdrop where the broader indices have faltered, underscoring the stock’s strong price momentum and technical alignment.
Read full news article
Shilpa Medicare Ltd Surges 7.03% to Day's High of Rs 588.4 — Outperforms Sector by 6.26 Percentage Points
The Sensex declined 0.74% on 23 Jun 2026 while Shilpa Medicare Ltd surged 7.03%, touching an intraday high of Rs 588.4. This 6.26-percentage-point outperformance over the Pharmaceuticals & Biotechnology sector highlights a distinctly stock-specific rally rather than a market-wide lift.
Read full news article
Shilpa Medicare Ltd is Rated Hold
Shilpa Medicare Ltd is rated 'Hold' by MarketsMOJO, with this rating last updated on 06 May 2026. While the rating change occurred on that date, the analysis and financial metrics presented here reflect the company’s current position as of 20 June 2026, providing investors with the most up-to-date view of the stock’s fundamentals, returns, and technical outlook.
Read full news article Announcements
Shilpa Medicare Limited - Other General Purpose
03-Dec-2019 | Source : NSEShilpa Medicare Limited has informed the Exchange regarding Disclosure of Related Party Transaction disclosure under Regulation 23(9) of the SEBI (Listing Obligations and Disclosure Requirements) Regulations, 2015.
Shilpa Medicare Limited - Outcome of Board Meeting
13-Nov-2019 | Source : NSEShilpa Medicare Limited has informed the Exchange regarding Board meeting held on November 09, 2019.
Shilpa Medicare Limited - Updates
06-Nov-2019 | Source : NSEShilpa Medicare Limited has informed the Exchange regarding ''.
Corporate Actions

No Upcoming Board Meetings

Shilpa Medicare Ltd has declared 100% dividend, ex-date: 17 Sep 25

Shilpa Medicare Ltd has announced 1:2 stock split, ex-date: 06 Nov 15

Shilpa Medicare Ltd has announced 1:1 bonus issue, ex-date: 03 Oct 25

No Rights history available
Quality key factors
Valuation key factors
Technicals key factors
 Technical Indicator Scale: Bearish, Mildly Bearish, Sideways, Mildly Bullish, Bullish Turned
 Shareholding Snapshot : Mar 2026
Shareholding Compare (%holding)
Non Institution
8.7265
Held by 10 Schemes (5.15%)
Held by 103 FIIs (11.08%)
Vishnukant Chaturbhuj Bhutada (6.51%)
Suraj Kumar Inani (4.01%)
27.7%
Quarterly Results Snapshot (Consolidated) - Mar'26 - QoQ

QoQ Growth in quarter ended Mar 2026 is 6.51% vs 10.90% in Dec 2025

QoQ Growth in quarter ended Mar 2026 is 141.79% vs 1.16% in Dec 2025
Half Yearly Results Snapshot (Consolidated) - Sep'25
Growth in half year ended Sep 2025 is 8.66% vs 11.02% in Sep 2024
Growth in half year ended Sep 2025 is 184.22% vs 1,046.95% in Sep 2024
Nine Monthly Results Snapshot (Consolidated) - Dec'25
YoY Growth in nine months ended Dec 2025 is 15.29% vs 11.13% in Dec 2024
YoY Growth in nine months ended Dec 2025 is 112.50% vs 765.40% in Dec 2024
Annual Results Snapshot (Consolidated) - Mar'26
YoY Growth in year ended Mar 2026 is 19.62% vs 11.71% in Mar 2025
YoY Growth in year ended Mar 2026 is 210.81% vs 145.65% in Mar 2025
About Shilpa Medicare Ltd

Company Coordinates


