
Compare FDC with Similar Stocks
Stock DNA
Pharmaceuticals & Biotechnology
INR 6,244 Cr (Small Cap)
21.00
34
1.31%
-0.20
11.98%
2.51
Total Returns (Price + Dividend) 
Latest dividend: 5.0160751028806585 per share ex-dividend date: Feb-11-2026
Risk Adjusted Returns v/s
Returns Beta

News

FDC Ltd is Rated Sell by MarketsMOJO
FDC Ltd is rated 'Sell' by MarketsMOJO, with this rating last updated on 27 May 2026. However, the analysis and financial metrics discussed here reflect the stock's current position as of 14 June 2026, providing investors with an up-to-date perspective on the company’s performance and outlook.
Read full news article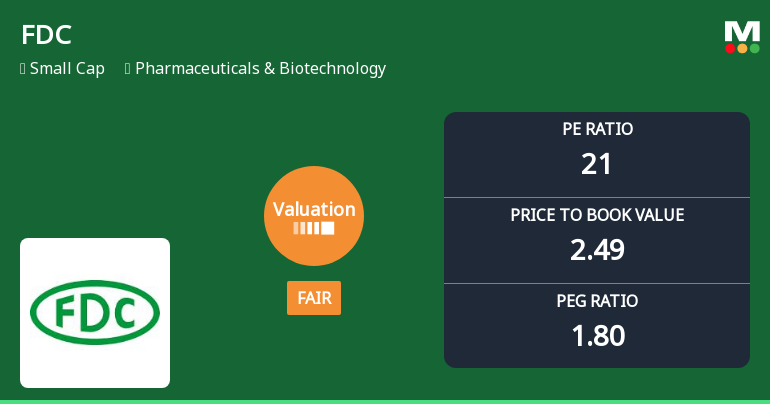
FDC Ltd Valuation Shifts to Fair Amidst Sector Volatility
FDC Ltd, a small-cap player in the Pharmaceuticals & Biotechnology sector, has witnessed a notable shift in its valuation parameters, moving from an expensive to a fair valuation grade. Despite a recent 5.04% decline in its share price to ₹380.75 on 8 June 2026, the company’s price-to-earnings (P/E) and price-to-book value (P/BV) ratios now suggest improved price attractiveness relative to its historical and peer averages. This article analyses the valuation changes, compares FDC’s metrics with sector peers, and assesses the implications for investors amid a challenging market backdrop.
Read full news article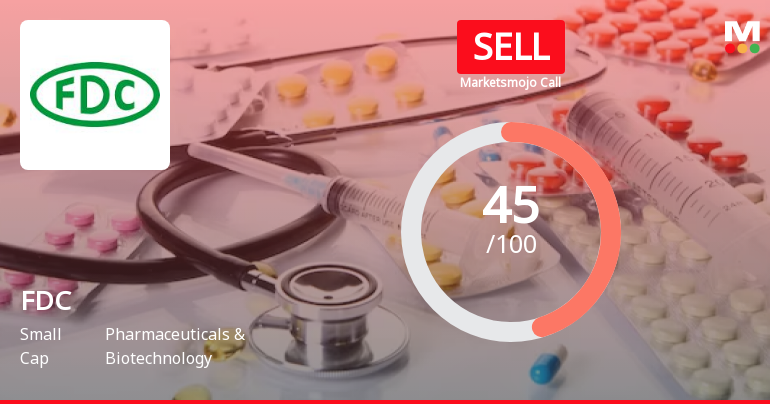
FDC Ltd is Rated Sell
FDC Ltd is rated 'Sell' by MarketsMOJO, with this rating last updated on 27 May 2026. However, the analysis and financial metrics discussed here reflect the stock's current position as of 03 June 2026, providing investors with the most up-to-date insight into the company’s performance and outlook.
Read full news article Announcements
FDC Limited - Clarification - Financial Results
14-Nov-2019 | Source : NSEFDC Limited for the quarter ended 30-Sep-2019 with respect to Regulation 33 of the SEBI (Listing Obligations and Disclosure Requirements) Regulations, 2015.
FDC Limited - Updates
18-Oct-2019 | Source : NSEFDC Limited has informed the Exchange regarding 'Acquisition of Registered Trademark/ Brand "ENTEROPLUS" from GlaxoSmithKline Pharmaceuticals Limited (GSK)'.
FDC Limited - Updates
16-Oct-2019 | Source : NSEFDC Limited has informed the Exchange regarding 'Certificate in terms of Regulation 74(5) of the Securities and Exchange Board of India (Depositories and Participants) Regulations, 2018 ( said regulations ) on behalf of FDC Limited ( the Company ) for the quarter ended on September 30, 2019'.'.
Corporate Actions

No Upcoming Board Meetings

FDC Ltd has declared 500% dividend, ex-date: 11 Feb 26

No Splits history available

No Bonus history available

No Rights history available
Quality key factors
Valuation key factors
Technicals key factors
 Technical Indicator Scale: Bearish, Mildly Bearish, Sideways, Mildly Bullish, Bullish Turned
 Shareholding Snapshot : Mar 2026
Shareholding Compare (%holding)
Promoters
None
Held by 6 Schemes (6.23%)
Held by 94 FIIs (2.4%)
Nomita R Chandavarkar (22.67%)
Icici Prudential Smallcap Fund (2.76%)
16.82%
Quarterly Results Snapshot (Consolidated) - Mar'26 - QoQ

QoQ Growth in quarter ended Mar 2026 is 25.84% vs -1.76% in Dec 2025
QoQ Growth in quarter ended Mar 2026 is 265.37% vs -0.25% in Dec 2025
Half Yearly Results Snapshot (Consolidated) - Sep'25

Growth in half year ended Sep 2025 is -2.66% vs 12.65% in Sep 2024
Growth in half year ended Sep 2025 is -21.65% vs 6.33% in Sep 2024
Nine Monthly Results Snapshot (Consolidated) - Dec'25
YoY Growth in nine months ended Dec 2025 is -1.86% vs 9.14% in Dec 2024
YoY Growth in nine months ended Dec 2025 is -21.96% vs -11.90% in Dec 2024
Annual Results Snapshot (Consolidated) - Mar'26
YoY Growth in year ended Mar 2026 is 2.98% vs 8.50% in Mar 2025
YoY Growth in year ended Mar 2026 is 5.48% vs -12.59% in Mar 2025
About FDC Ltd

Company Coordinates


