
Compare Global Surfaces with Similar Stocks
Dashboard
With a Operating Losses, the company has a Weak Long Term Fundamental Strength
- The company has been able to generate a Return on Equity (avg) of 3.73% signifying low profitability per unit of shareholders funds
The company declared negative results in Mar'26 after flat results in Dec'25
Risky - Negative EBITDA
Consistent Underperformance against the benchmark over the last 3 years
Stock DNA
Diversified consumer products
INR 160 Cr (Micro Cap)
NA (Loss Making)
32
0.00%
0.75
-11.25%
0.60
Total Returns (Price + Dividend) 
Global Surfaces for the last several years.
Risk Adjusted Returns v/s
Returns Beta

News
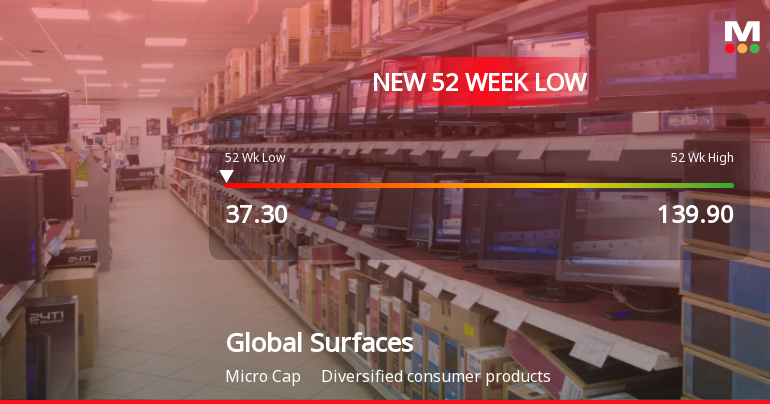
Global Surfaces Ltd Falls to 52-Week Low of Rs 37.3 as Sell-Off Deepens
For the third consecutive session, Global Surfaces Ltd has seen its share price decline, culminating in a fresh 52-week low of Rs 37.3 on 10 Jul 2026. This marks a significant 73.3% drop from its 52-week high of Rs 139.9, underscoring persistent selling pressure despite broader market gains.
Read full news article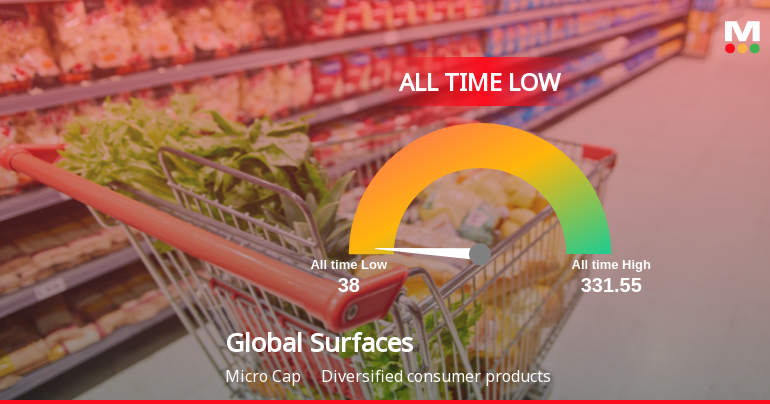
Global Surfaces Ltd Extends Losing Streak, Hits All-Time Low Amid Steep Decline
The pace of the sell-off has accelerated sharply, with Global Surfaces Ltd losing over 62% year-to-date and touching a new all-time low of Rs 38 on 10 Jul 2026, underscoring a challenging period for the micro-cap diversified consumer products company.
Read full news article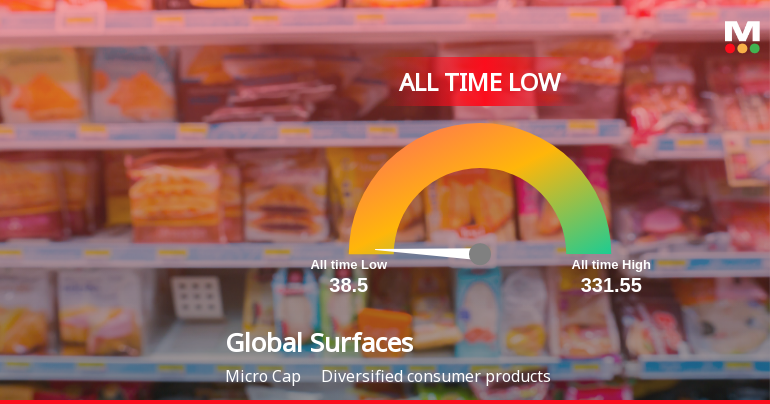
A 66.5% Year-to-Date Decline Pushes Global Surfaces Ltd to Its Weakest Level Ever
The stock of Global Surfaces Ltd has plunged to an all-time low of Rs.38.5 on 09 Jul 2026, marking a steep 61.62% decline year-to-date and a staggering 66.52% drop over the past year, far outpacing the broader market's losses.
Read full news article Announcements
Receipt Of Order Passed Under Section 271D Of Income Tax Act 1961
30-Jun-2026 | Source : BSEThe Company has received an order dated June 29 2026 passed under section 271D of Income Tax Act 1961.
Closure of Trading Window
26-Jun-2026 | Source : BSEIntimation for Closure of Trading Window with effect from July 1 2026 till 48 hours after declaration of Financial Results for the quarter ending June 30 2026.
Proceedings Of Postal Ballot
25-Jun-2026 | Source : BSEProceedings of business transacted through the Postal Ballot Notice dated May 25 2026.
Corporate Actions

No Upcoming Board Meetings

No Dividend history available

No Splits history available

No Bonus history available

No Rights history available
Quality key factors
Valuation key factors
Technicals key factors
 Technical Indicator Scale: Bearish, Mildly Bearish, Sideways, Mildly Bullish, Bullish Turned
 Shareholding Snapshot : Mar 2026
Shareholding Compare (%holding)
Promoters
None
Held by 0 Schemes
Held by 4 FIIs (1.59%)
Mayank Shah (55.46%)
Narendra Goel (1.5%)
18.45%
Quarterly Results Snapshot (Consolidated) - Mar'26 - QoQ

QoQ Growth in quarter ended Mar 2026 is -23.42% vs 9.60% in Dec 2025
QoQ Growth in quarter ended Mar 2026 is -641.53% vs 35.55% in Dec 2025
Half Yearly Results Snapshot (Consolidated) - Sep'25
Growth in half year ended Sep 2025 is 23.50% vs 35.91% in Sep 2024

Growth in half year ended Sep 2025 is 33.16% vs -255.71% in Sep 2024
Nine Monthly Results Snapshot (Consolidated) - Dec'25
YoY Growth in nine months ended Dec 2025 is 25.09% vs 28.71% in Dec 2024
YoY Growth in nine months ended Dec 2025 is 55.02% vs -320.42% in Dec 2024
Annual Results Snapshot (Consolidated) - Mar'26
YoY Growth in year ended Mar 2026 is 12.33% vs -7.83% in Mar 2025
YoY Growth in year ended Mar 2026 is -6.62% vs -252.62% in Mar 2025
About Global Surfaces Ltd

Company Coordinates


