
Compare Essen Speciality with Similar Stocks
Dashboard
Poor Management Efficiency with a low ROE of 8.28%
- The company has been able to generate a Return on Equity (avg) of 8.28% signifying low profitability per unit of shareholders funds
Poor long term growth as Operating profit has grown by an annual rate -161.55% of over the last 5 years
Negative results in Mar 26
Risky - Negative Operating Profits
Below par performance in long term as well as near term
Stock DNA
Diversified consumer products
INR 291 Cr (Micro Cap)
NA (Loss Making)
36
0.85%
0.05
-2.56%
1.85
Total Returns (Price + Dividend) 
Latest dividend: 1 per share ex-dividend date: Sep-19-2025
Risk Adjusted Returns v/s
Returns Beta

News
Essen Speciality Films Ltd is Rated Strong Sell
Essen Speciality Films Ltd is rated Strong Sell by MarketsMOJO, with this rating last updated on 30 January 2026. However, the analysis and financial metrics discussed here reflect the stock’s current position as of 22 June 2026, providing investors with the latest insights into the company’s performance and outlook.
Read full news article
Essen Speciality Films Ltd is Rated Strong Sell
Essen Speciality Films Ltd is rated Strong Sell by MarketsMOJO, with this rating last updated on 30 January 2026. However, the analysis and financial metrics presented here reflect the stock’s current position as of 11 June 2026, providing investors with an up-to-date perspective on the company’s performance and outlook.
Read full news article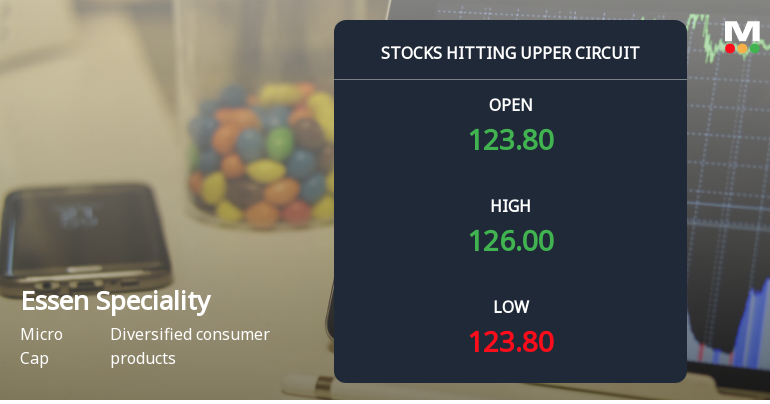
Essen Speciality Films Ltd Locks at Upper Circuit With 5.0% Gain — Buyers Queue, Sellers Absent
At Rs 126.0, the buying was done — not because demand dried up, but because the exchange wouldn't let the stock go any higher. Essen Speciality Films Ltd locked at its upper circuit of 5.0% on 2 Jun 2026, with buyers queuing and no sellers willing to part with shares.
Read full news article Announcements
Corporate Actions

No Upcoming Board Meetings

Essen Speciality Films Ltd has declared 10% dividend, ex-date: 19 Sep 25

No Splits history available

Essen Speciality Films Ltd has announced 1:5 bonus issue, ex-date: 13 Dec 24

No Rights history available
Quality key factors
Valuation key factors
Technicals key factors
 Technical Indicator Scale: Bearish, Mildly Bearish, Sideways, Mildly Bullish, Bullish Turned
 Shareholding Snapshot : Mar 2026
Shareholding Compare (%holding)
Promoters
None
Held by 0 Schemes
Held by 0 FIIs
Karishma Rajesh Doshi (14.88%)
None
24.58%
Quarterly Results Snapshot (Standalone) - Mar'26 - QoQ

QoQ Growth in quarter ended Mar 2026 is -22.45% vs -14.33% in Dec 2025
QoQ Growth in quarter ended Mar 2026 is -300.00% vs -142.39% in Dec 2025
Half Yearly Results Snapshot (Standalone) - Mar'26
Growth in half year ended Mar 2026 is -17.84% vs -2.86% in Sep 2025
Growth in half year ended Mar 2026 is -257.82% vs 172.27% in Sep 2025
Nine Monthly Results Snapshot (Standalone) - Dec'25
YoY Growth in nine months ended Dec 2025 is 2.06% vs 24.69% in Dec 2024
YoY Growth in nine months ended Dec 2025 is -71.04% vs 34.12% in Dec 2024
Annual Results Snapshot (Standalone) - Mar'26
YoY Growth in year ended Mar 2026 is -5.75% vs 21.25% in Mar 2025
YoY Growth in year ended Mar 2026 is -134.98% vs -18.89% in Mar 2025
About Essen Speciality Films Ltd

Company Coordinates


