
Compare Robust Hotels with Similar Stocks
Dashboard
Weak Long Term Fundamental Strength with an average Return on Capital Employed (ROCE) of 2.22%
- Poor long term growth as Net Sales has grown by an annual rate of 11.72% over the last 5 years
- Low ability to service debt as the company has a high Debt to EBITDA ratio of 3.08 times
Underperformed the market in the last 1 year
Total Returns (Price + Dividend) 
Robust Hotels for the last several years.
Risk Adjusted Returns v/s
Returns Beta

News

Robust Hotels Ltd is Rated Sell
Robust Hotels Ltd is rated 'Sell' by MarketsMOJO, with this rating last updated on 1 June 2026. However, the analysis and financial metrics discussed here reflect the stock's current position as of 11 June 2026, providing investors with an up-to-date view of the company’s fundamentals, valuation, financial trend, and technical outlook.
Read full news article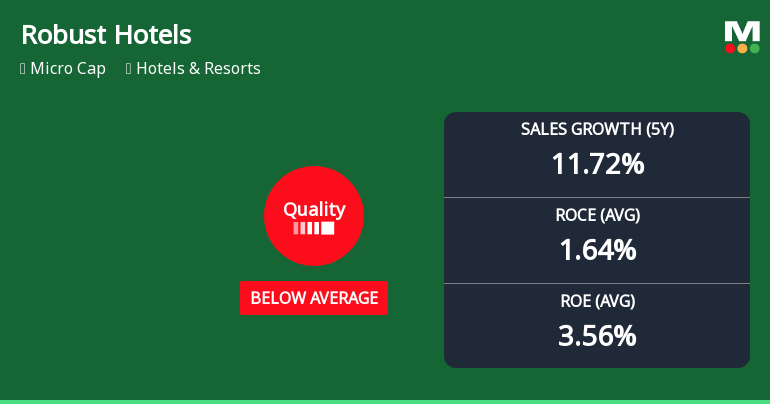
Robust Hotels Ltd Downgraded to Sell as Quality Parameters Deteriorate
Robust Hotels Ltd has seen its quality rating downgraded from average to below average, prompting a shift in its Mojo Grade from Hold to Sell as of 1 June 2026. Despite a recent surge in share price, the company’s fundamental metrics reveal a complex picture of improving earnings growth but persistently weak returns and operational efficiency, raising concerns about its long-term value proposition in the Hotels & Resorts sector.
Read full news article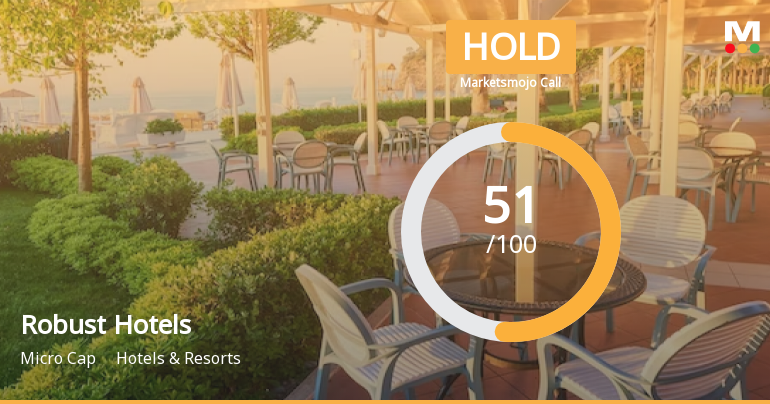
Robust Hotels Ltd is Rated Hold
Robust Hotels Ltd is rated 'Hold' by MarketsMOJO, with this rating last updated on 19 May 2026. However, the analysis and financial metrics discussed here reflect the company’s current position as of 31 May 2026, providing investors with the most recent and relevant data to assess the stock’s outlook.
Read full news article Announcements
Announcement under Regulation 30 (LODR)-Newspaper Publication
01-Jun-2026 | Source : BSEPlease find enclosed
Compliances-Reg.24(A)-Annual Secretarial Compliance
29-May-2026 | Source : BSEPlease find enclosed the Annual Secretarial compliance report for the year ended 31st March 2026
Financial Results For The Quarter And Financial Year Ended 31St March 2026
28-May-2026 | Source : BSEPlease find enclosed the financial results for the quarter and financial year ended 31st March 2026
Corporate Actions

No Upcoming Board Meetings

No Dividend history available

No Splits history available

No Bonus history available

No Rights history available
Quality key factors
Valuation key factors
Technicals key factors
 Technical Indicator Scale: Bearish, Mildly Bearish, Sideways, Mildly Bullish, Bullish Turned
 Shareholding Snapshot : Mar 2026
Shareholding Compare (%holding)
Promoters
None
Held by 4 Schemes (0.0%)
Held by 2 FIIs (0.01%)
Saraf Industries Limited (41.9%)
Satishkumar Devkarandas Huf (0.3%)
19.14%
Quarterly Results Snapshot (Standalone) - Mar'26 - QoQ

QoQ Growth in quarter ended Mar 2026 is 3.97% vs 7.67% in Dec 2025
QoQ Growth in quarter ended Mar 2026 is 9.46% vs 21.23% in Dec 2025
Half Yearly Results Snapshot (Standalone) - Sep'25
Growth in half year ended Sep 2025 is 8.58% vs 20.17% in Sep 2024
Growth in half year ended Sep 2025 is 170.14% vs 1,927.78% in Sep 2024
Nine Monthly Results Snapshot (Standalone) - Dec'25
YoY Growth in nine months ended Dec 2025 is 11.70% vs 14.23% in Dec 2024

YoY Growth in nine months ended Dec 2025 is 174.11% vs 130.60% in Dec 2024
Annual Results Snapshot (Standalone) - Mar'26
YoY Growth in year ended Mar 2026 is 8.80% vs 11.29% in Mar 2025
YoY Growth in year ended Mar 2026 is 50.06% vs 247.26% in Mar 2025
About Robust Hotels Ltd

Company Coordinates


