
Compare IKIO Tech with Similar Stocks
Dashboard
Poor Management Efficiency with a low ROE of 7.59%
- The company has been able to generate a Return on Equity (avg) of 7.59% signifying low profitability per unit of shareholders funds
Company has a Debt to Equity ratio (avg) of 0.01 times
Poor long term growth as Operating profit has grown by an annual rate -12.68% of over the last 5 years
With a growth in Net Profit of 62.83%, the company declared Outstanding results in Mar 26
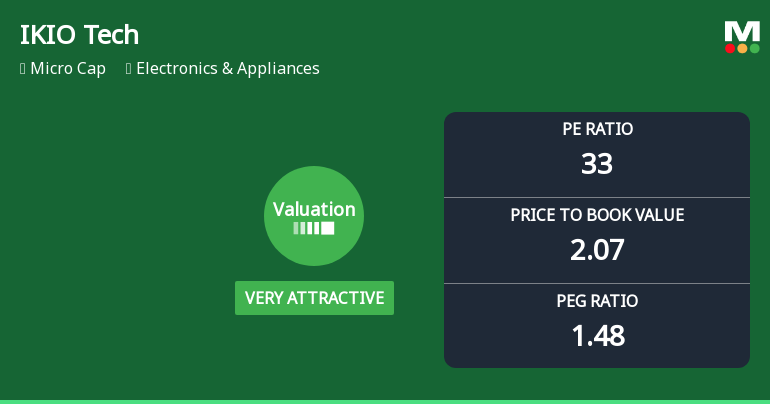
With ROE of 6.3, it has a Very Attractive valuation with a 2.1 Price to Book Value
Majority shareholders : Promoters
Stock DNA
Electronics & Appliances
INR 1,261 Cr (Micro Cap)
33.00
58
0.00%
0.02
6.28%
2.07
Total Returns (Price + Dividend) 
Latest dividend: 1 per share ex-dividend date: Aug-13-2024
Risk Adjusted Returns v/s
Returns Beta

News
IKIO Technologies Ltd Valuation Shifts Signal Renewed Price Attractiveness
IKIO Technologies Ltd, a micro-cap player in the Electronics & Appliances sector, has seen a marked improvement in its valuation parameters, shifting from an 'attractive' to a 'very attractive' rating. This change reflects a significant reappraisal of the stock’s price metrics relative to its historical averages and peer group, suggesting a potential inflection point for investors evaluating its price-to-earnings and price-to-book value ratios amid a challenging market backdrop.
Read full news article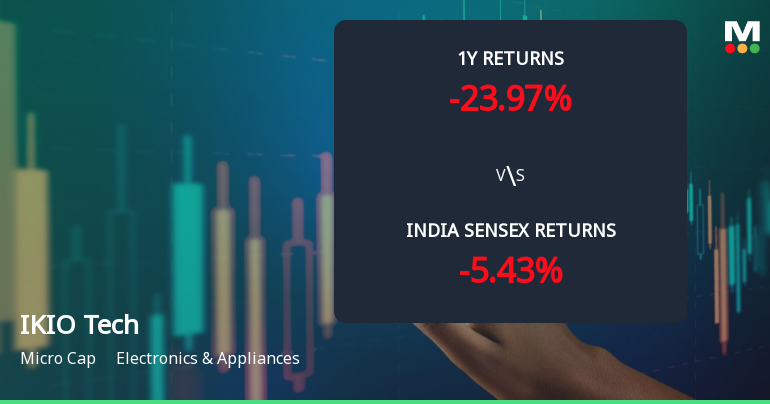
IKIO Technologies Ltd Technical Momentum Shifts Amid Mixed Market Signals
IKIO Technologies Ltd, a micro-cap player in the Electronics & Appliances sector, has recently exhibited a notable shift in its technical momentum, moving from a mildly bearish stance to a sideways trend. This transition is underscored by a complex interplay of technical indicators, including MACD, RSI, Bollinger Bands, and moving averages, which collectively paint a nuanced picture of the stock’s near-term prospects amid broader market challenges.
Read full news article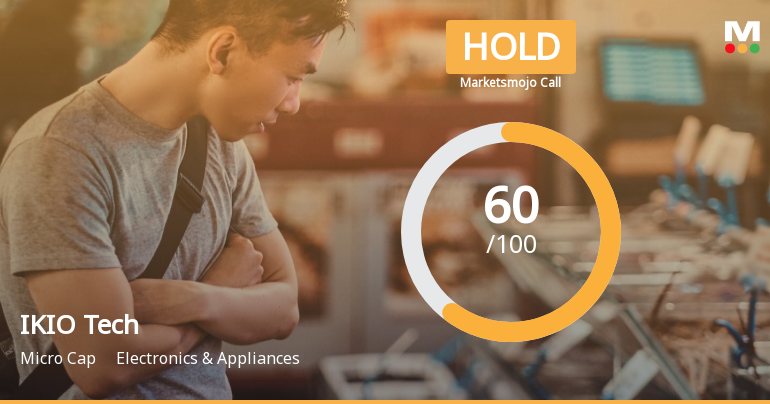
IKIO Technologies Ltd is Rated Hold
IKIO Technologies Ltd is rated 'Hold' by MarketsMOJO, with this rating last updated on 04 May 2026. However, the analysis and financial metrics discussed here reflect the stock's current position as of 17 June 2026, providing investors with an up-to-date view of the company’s fundamentals, returns, and market standing.
Read full news article Announcements
Disclosure Under Regulation 30 Of The SEBI(LODR) - Investors / Analysts Meet - Outcome
16-Jun-2026 | Source : BSEDisclosure under Regulation 30 of the SEBI (LODR) - Investors / Analysts meet - Outcome
Intimation Of Schedule Of Analyst/Institutional Investor Meetings Under The SEBI (Listing Obligations And Disclosure Requirements) Regulations 2015
11-Jun-2026 | Source : BSEIntimation of Schedule of Analyst / Institutional Investor Meetings under the SEBI (Listing Obligations and Disclosure Requirements) Regulations 2015
Newspaper Publication For The Postponement Of 10Th Annual General Meeting Of The Company
08-Jun-2026 | Source : BSENewspaper Publication for the Postponement of the 10th Annual General Meeting of the Company.
Corporate Actions

No Upcoming Board Meetings

IKIO Technologies Ltd has declared 10% dividend, ex-date: 13 Aug 24

No Splits history available

No Bonus history available

No Rights history available
Quality key factors
Valuation key factors
Technicals key factors
 Technical Indicator Scale: Bearish, Mildly Bearish, Sideways, Mildly Bullish, Bullish Turned
 Shareholding Snapshot : Mar 2026
Shareholding Compare (%holding)
Promoters
None
Held by 1 Schemes (1.19%)
Held by 5 FIIs (0.9%)
Hardeep Singh (42.78%)
Ganesh Srinivasan (1.29%)
22.21%
Quarterly Results Snapshot (Consolidated) - Mar'26 - QoQ

QoQ Growth in quarter ended Mar 2026 is 13.57% vs -11.34% in Dec 2025
QoQ Growth in quarter ended Mar 2026 is 79.43% vs -8.37% in Dec 2025
Half Yearly Results Snapshot (Consolidated) - Sep'25
Growth in half year ended Sep 2025 is 12.80% vs 11.40% in Sep 2024

Growth in half year ended Sep 2025 is -52.13% vs -20.91% in Sep 2024
Nine Monthly Results Snapshot (Consolidated) - Dec'25
YoY Growth in nine months ended Dec 2025 is 15.08% vs 8.87% in Dec 2024
YoY Growth in nine months ended Dec 2025 is -35.84% vs -34.85% in Dec 2024
Annual Results Snapshot (Consolidated) - Mar'26
YoY Growth in year ended Mar 2026 is 22.52% vs 10.94% in Mar 2025
YoY Growth in year ended Mar 2026 is 22.39% vs -48.97% in Mar 2025
About IKIO Technologies Ltd

Company Coordinates


