
Compare Asian Warehous. with Similar Stocks
Dashboard
Weak Long Term Fundamental Strength with a -8.60% CAGR growth in Operating Profits over the last 5 years
- Company's ability to service its debt is weak with a poor EBIT to Interest (avg) ratio of 0.85
- The company has been able to generate a Return on Equity (avg) of 0.55% signifying low profitability per unit of shareholders funds
Below par performance in long term as well as near term
Stock DNA
Other Consumer Services
INR 13 Cr (Micro Cap)
52.00
32
0.00%
0.25
0.88%
0.49
Total Returns (Price + Dividend) 
Asian Warehous. for the last several years.
Risk Adjusted Returns v/s
Returns Beta

News
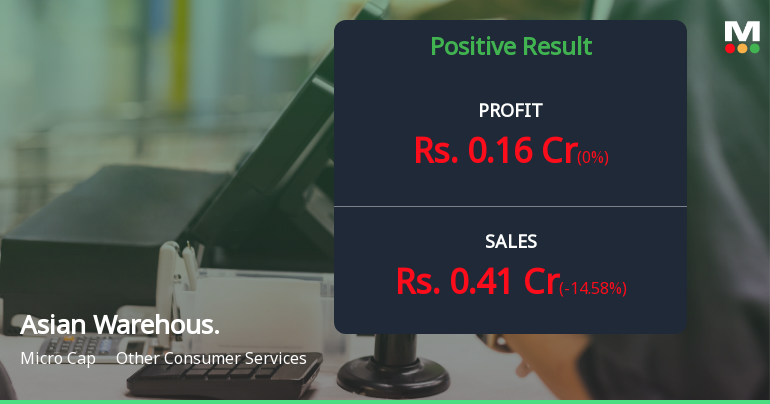
Asian Warehousing Q4 FY26: Profitability Returns Amid Persistent Revenue Challenges
Asian Warehousing Limited, a micro-cap player in the consumer services sector with a market capitalisation of ₹13.00 crores, reported a return to profitability in Q4 FY26 with net profit of ₹0.16 crores, marking the highest quarterly earnings in recent periods. However, this positive development came against a backdrop of sharply declining revenues, with net sales plunging 65.25% year-on-year to ₹0.41 crores, raising critical questions about the sustainability of the company's business model.
Read full news article Announcements
Announcement under Regulation 30 (LODR)-Newspaper Publication
31-May-2026 | Source : BSEPlease find enclosed the newspaper publication of financial results for the quarter and year ended 31.03.2026.
Results - Financial Results For The Quarter And Year Ended 31.03.2026
29-May-2026 | Source : BSEPlease find enclosed the results for the quarter and year ended 31.03.2026
Non-Applicability Of Related Party Transaction Provisions Of SEBI (Listing Obligations And Disclosure Requirements) Regulations 2015 For The Half Year Ended 31.03.2026.
29-May-2026 | Source : BSEPlease find enclosed.
Corporate Actions

No Upcoming Board Meetings

No Dividend history available

No Splits history available

No Bonus history available

No Rights history available
Quality key factors
Valuation key factors
Technicals key factors
 Technical Indicator Scale: Bearish, Mildly Bearish, Sideways, Mildly Bullish, Bullish Turned
 Shareholding Snapshot : Mar 2026
Shareholding Compare (%holding)
Promoters
None
Held by 3 Schemes (0.02%)
Held by 0 FIIs
Rashmi C Bhimjyani (40.3%)
Bhushan Karia (4.1%)
25.35%
Quarterly Results Snapshot (Standalone) - Mar'26 - QoQ

QoQ Growth in quarter ended Mar 2026 is -14.58% vs 4.35% in Dec 2025

QoQ Growth in quarter ended Mar 2026 is 0.00% vs -100.00% in Dec 2025
Half Yearly Results Snapshot (Standalone) - Sep'25
Growth in half year ended Sep 2025 is 25.00% vs -14.29% in Sep 2024
Growth in half year ended Sep 2025 is -50.00% vs 1,500.00% in Sep 2024
Nine Monthly Results Snapshot (Standalone) - Dec'25
YoY Growth in nine months ended Dec 2025 is 45.26% vs -24.00% in Dec 2024
YoY Growth in nine months ended Dec 2025 is 40.00% vs -37.50% in Dec 2024
Annual Results Snapshot (Standalone) - Mar'26
YoY Growth in year ended Mar 2026 is -15.96% vs 30.67% in Mar 2025
YoY Growth in year ended Mar 2026 is 283.33% vs -60.00% in Mar 2025
About Asian Warehousing Ltd

Company Coordinates


