
Compare Ideaforge Tech with Similar Stocks
Dashboard
Weak Long Term Fundamental Strength with an average Return on Equity (ROE) of 0%
- Poor long term growth as Operating profit has grown by an annual rate -202.78% of over the last 5 years
- Company's ability to service its debt is weak with a poor EBIT to Interest (avg) ratio of -11.67
With a growth in Net Sales of 347.04%, the company declared Very Positive results in Mar 26
Risky - Negative Operating Profits
Market Beating Performance
Stock DNA
Aerospace & Defense
INR 4,412 Cr (Small Cap)
NA (Loss Making)
54
0.00%
-0.04
-2.84%
7.26
Total Returns (Price + Dividend) 
Ideaforge Tech for the last several years.
Risk Adjusted Returns v/s
Returns Beta

News

Ideaforge Technology Ltd Upgraded to Hold on Improved Technicals and Strong Quarterly Results
Ideaforge Technology Ltd has seen its investment rating upgraded from Sell to Hold, driven primarily by a marked improvement in technical indicators and robust quarterly financial results. Despite some lingering concerns over long-term fundamentals, the company’s recent performance and market behaviour have prompted a reassessment of its outlook.
Read full news article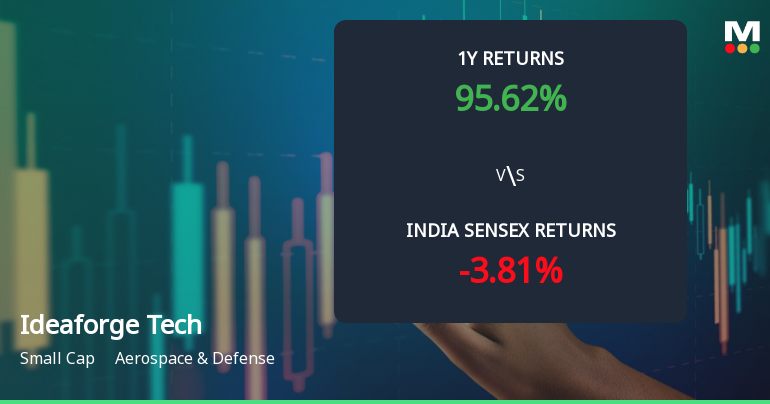
Ideaforge Technology Ltd Technical Momentum Shifts to Bullish Amid Strong Year-to-Date Gains
Ideaforge Technology Ltd has demonstrated a notable shift in price momentum, moving from a mildly bullish to a bullish technical trend, supported by a series of mixed but improving technical indicators. The stock’s recent performance and technical signals suggest a cautiously optimistic outlook for investors within the Aerospace & Defense sector.
Read full news article Announcements
Receipt Of Letter Of Intent (LOI) From Technology Development Board (TDB) To Ideaforge Technology Limited
31-Jul-2026 | Source : BSEReceipt of Letter of Intent from Technology Development Board to ideaForge Technology Limited.
Board Meeting Intimation for Adoption Of Unaudited Financial Results For The Quarter Ended June 30 2026
30-Jul-2026 | Source : BSEIdeaforge Technology Ltdhas informed BSE that the meeting of the Board of Directors of the Company is scheduled on 10/08/2026 inter alia to consider and approve Adoption of Unaudited Financial Results for the quarter ended June 30 2026
Announcement under Regulation 30 (LODR)-Allotment of ESOP / ESPS
30-Jul-2026 | Source : BSEAllotment of Equity shares under the Employee stock option scheme of ideaForge Technology Limited
Corporate Actions

10 Aug 2026

No Dividend history available

No Splits history available

No Bonus history available

No Rights history available
Quality key factors
Valuation key factors
Technicals key factors
 Technical Indicator Scale: Bearish, Mildly Bearish, Sideways, Mildly Bullish, Bullish Turned
 Shareholding Snapshot : Jul 2026
Shareholding Compare (%holding)
Non Institution
2.9504
Held by 10 Schemes (9.14%)
Held by 40 FIIs (8.26%)
Ankit Mehta (7.42%)
Florintree Enterprise Llp (7.22%)
33.77%
Quarterly Results Snapshot (Consolidated) - Mar'26 - QoQ

QoQ Growth in quarter ended Mar 2026 is 347.04% vs -22.60% in Dec 2025
QoQ Growth in quarter ended Mar 2026 is 277.22% vs -72.53% in Dec 2025
Half Yearly Results Snapshot (Consolidated) - Sep'25

Growth in half year ended Sep 2025 is -56.57% vs 2.06% in Sep 2024
Growth in half year ended Sep 2025 is -244.06% vs -163.54% in Sep 2024
Nine Monthly Results Snapshot (Consolidated) - Dec'25
YoY Growth in nine months ended Dec 2025 is -39.61% vs -33.44% in Dec 2024
YoY Growth in nine months ended Dec 2025 is -110.64% vs -205.85% in Dec 2024
Annual Results Snapshot (Consolidated) - Mar'26
YoY Growth in year ended Mar 2026 is 40.26% vs -48.66% in Mar 2025
YoY Growth in year ended Mar 2026 is 72.66% vs -237.57% in Mar 2025
About Ideaforge Technology Ltd

Company Coordinates


