
Compare Khazanchi Jewell with Similar Stocks
Dashboard
With ROCE of 27.7, it has a Expensive valuation with a 5 Enterprise value to Capital Employed
- Over the past year, while the stock has generated a return of 11.29%, its profits have risen by 99% ; the PEG ratio of the company is 0.2
Despite the size of the company, domestic mutual funds hold only 0% of the company
Stock DNA
Gems, Jewellery And Watches
INR 1,539 Cr (Micro Cap)
17.00
48
0.00%
0.19
33.25%
5.79
Total Returns (Price + Dividend) 
Latest dividend: 0.5 per share ex-dividend date: Nov-27-2024
Risk Adjusted Returns v/s
Returns Beta

News
Khazanchi Jewellers Ltd is Rated Sell
Khazanchi Jewellers Ltd is rated Sell by MarketsMOJO, with this rating last updated on 12 May 2026. However, all fundamentals, returns, and financial metrics discussed here reflect the stock’s current position as of 15 June 2026, providing investors with the most up-to-date analysis.
Read full news article
Khazanchi Jewellers Ltd is Rated Sell
Khazanchi Jewellers Ltd is rated 'Sell' by MarketsMOJO, with this rating last updated on 12 May 2026. However, all fundamentals, returns, and financial metrics discussed here reflect the stock’s current position as of 04 June 2026, providing investors with the latest comprehensive analysis.
Read full news article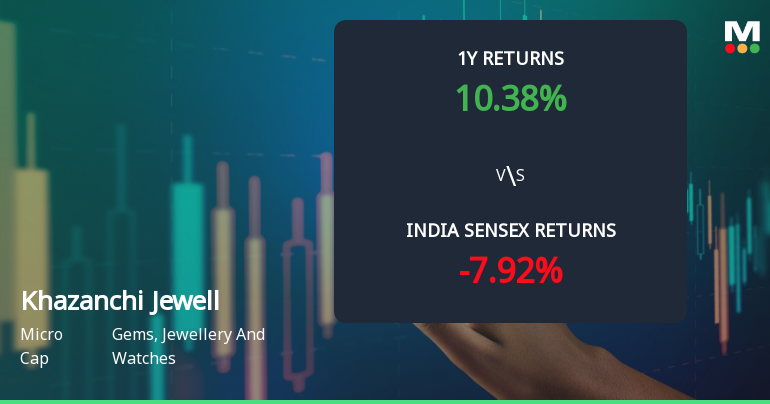
Khazanchi Jewellers Ltd Technical Momentum Shifts Amid Bearish Sentiment
Khazanchi Jewellers Ltd, a micro-cap player in the Gems, Jewellery and Watches sector, has seen a notable shift in its technical momentum, prompting a downgrade in its Mojo Grade from Hold to Sell as of 12 May 2026. The stock’s price momentum indicators reveal a bearish tilt, reflecting growing investor caution amid broader market pressures and sector-specific challenges.
Read full news article Announcements
Announcement under Regulation 30 (LODR)-Earnings Call Transcript
08-Jun-2026 | Source : BSEEarnings Call Transcript
Announcement under Regulation 30 (LODR)-Investor Presentation
04-Jun-2026 | Source : BSEInvestor Presentation H2FY26
Announcement under Regulation 30 (LODR)-Analyst / Investor Meet - Outcome
04-Jun-2026 | Source : BSEConcall Outcome H2FY26
Corporate Actions

No Upcoming Board Meetings

Khazanchi Jewellers Ltd has declared 5% dividend, ex-date: 27 Nov 24

No Splits history available

No Bonus history available

No Rights history available
Quality key factors
Valuation key factors
Technicals key factors
 Technical Indicator Scale: Bearish, Mildly Bearish, Sideways, Mildly Bullish, Bullish Turned
 Shareholding Snapshot : Mar 2026
Shareholding Compare (%holding)
Promoters
None
Held by 0 Schemes
Held by 1 FIIs (0.02%)
Tarachand Mehta (10.57%)
Svcm Securities Private Limited (1.61%)
20.2%
Quarterly Results Snapshot (Standalone) - Mar'26 - QoQ

QoQ Growth in quarter ended Mar 2026 is -13.78% vs 7.37% in Dec 2025
QoQ Growth in quarter ended Mar 2026 is 1.83% vs 6.71% in Dec 2025
Half Yearly Results Snapshot (Standalone) - Mar'26

Growth in half year ended Mar 2026 is 15.18% vs -6.24% in Sep 2025
Growth in half year ended Mar 2026 is 31.06% vs 55.36% in Sep 2025
Nine Monthly Results Snapshot (Standalone) - Dec'25
YoY Growth in nine months ended Dec 2025 is 34.04% vs 25.87% in Dec 2024
YoY Growth in nine months ended Dec 2025 is 96.88% vs -21.52% in Dec 2024
Annual Results Snapshot (Standalone) - Mar'26
YoY Growth in year ended Mar 2026 is 15.65% vs 115.88% in Mar 2025
YoY Growth in year ended Mar 2026 is 98.89% vs 64.57% in Mar 2025
About Khazanchi Jewellers Ltd

Company Coordinates


