
Compare Vishnu Prakash R with Similar Stocks
Dashboard
With a Operating Losses, the company has a Weak Long Term Fundamental Strength
- Company's ability to service its debt is weak with a poor EBIT to Interest (avg) ratio of 1.76
- The company has been able to generate a Return on Equity (avg) of 8.15% signifying low profitability per unit of shareholders funds
With a fall in Operating Profit of -663.74%, the company declared Very Negative results in Mar 26
Risky - Negative EBITDA
87.71% of Promoter Shares are Pledged
Stock DNA
Construction
INR 371 Cr (Micro Cap)
NA (Loss Making)
35
0.00%
0.94
-22.25%
0.59
Total Returns (Price + Dividend) 
Vishnu Prakash R for the last several years.
Risk Adjusted Returns v/s
Returns Beta

News

Vishnu Prakash R Punglia Ltd is Rated Strong Sell
Vishnu Prakash R Punglia Ltd is rated Strong Sell by MarketsMOJO. This rating was last updated on 10 Nov 2025. However, the analysis and financial metrics presented here reflect the company’s current position as of 26 June 2026, providing investors with the latest insights into its performance and outlook.
Read full news article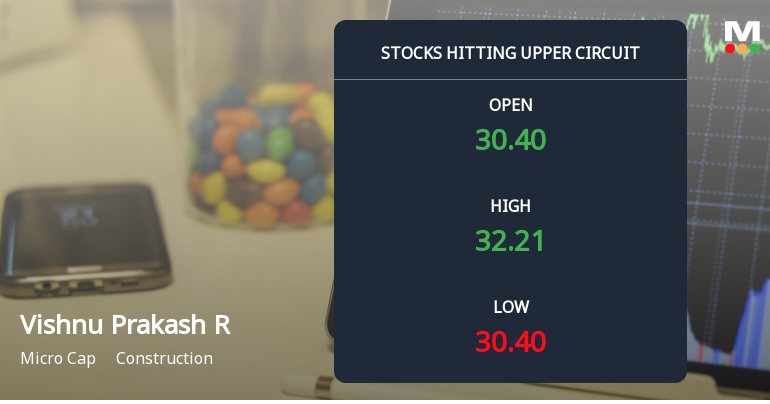
Vishnu Prakash R Punglia Ltd Locks at Upper Circuit With 4.97% Gain — Buyers Queue, Sellers Absent
At Rs 32.11, the buying was done — not because demand dried up, but because the exchange wouldn't let the stock go any higher. Vishnu Prakash R Punglia Ltd locked at its upper circuit of 4.97% on 18 Jun 2026, with buyers queuing and no sellers willing to part with shares.
Read full news article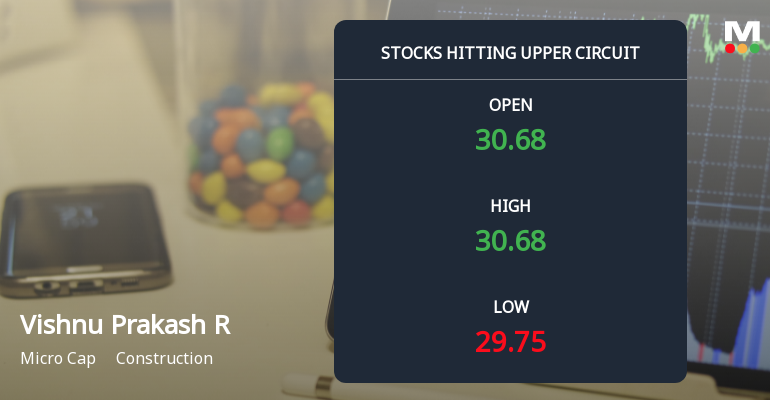
Vishnu Prakash R Punglia Ltd Locks at Upper Circuit With 5% Gain — Buyers Queue, Sellers Absent
At Rs 30.59, the buying was done — not because demand dried up, but because the exchange wouldn't let the stock go any higher. Vishnu Prakash R Punglia Ltd locked at its upper circuit of 5% on 17 Jun 2026, with buyers queuing and no sellers willing to part with shares.
Read full news article Announcements
Disclosures under Reg. 29(2) of SEBI (SAST) Regulations 2011
17-Jun-2026 | Source : BSEThe Exchange has received the disclosure under Regulation 29(2) of SEBI (Substantial Acquisition of Shares & Takeovers) Regulations 2011 for Pooja Punglia
Disclosures under Reg. 31(1) and 31(2) of SEBI (SAST) Regulations 2011.
17-Jun-2026 | Source : BSEThe Exchange has received Disclosure under Regulation 31(1) and 31(2) of SEBI (Substantial Acquisition of Shares & Takeovers) Regulations 2011 on June 16 2026 for Pooja Punglia
Disclosures under Reg. 29(2) of SEBI (SAST) Regulations 2011
16-Jun-2026 | Source : BSEThe Exchange has received the disclosure under Regulation 29(2) of SEBI (Substantial Acquisition of Shares & Takeovers) Regulations 2011 for Ajay Pungaliya
Corporate Actions

No Upcoming Board Meetings

No Dividend history available

No Splits history available

No Bonus history available

No Rights history available
Quality key factors
Valuation key factors
Technicals key factors
 Technical Indicator Scale: Bearish, Mildly Bearish, Sideways, Mildly Bullish, Bullish Turned
 Shareholding Snapshot : Mar 2026
Shareholding Compare (%holding)
Non Institution
87.7078
Held by 2 Schemes (4.08%)
Held by 3 FIIs (0.27%)
Vishnu Prakash Punglia (8.56%)
Quant Mutual Fund - Quant Small Cap Fund (4.08%)
45.27%
Quarterly Results Snapshot (Standalone) - Mar'26 - QoQ

QoQ Growth in quarter ended Mar 2026 is -42.74% vs -39.98% in Dec 2025

QoQ Growth in quarter ended Mar 2026 is -336.26% vs -921.37% in Dec 2025
Half Yearly Results Snapshot (Standalone) - Sep'25
Growth in half year ended Sep 2025 is -3.27% vs 2.93% in Sep 2024
Growth in half year ended Sep 2025 is -72.31% vs 2.18% in Sep 2024
Nine Monthly Results Snapshot (Standalone) - Dec'25
YoY Growth in nine months ended Dec 2025 is -9.95% vs 1.92% in Dec 2024
YoY Growth in nine months ended Dec 2025 is -145.61% vs -23.05% in Dec 2024
Annual Results Snapshot (Standalone) - Mar'26
YoY Growth in year ended Mar 2026 is -31.21% vs -16.04% in Mar 2025
YoY Growth in year ended Mar 2026 is -356.18% vs -52.04% in Mar 2025
About Vishnu Prakash R Punglia Ltd

Company Coordinates


