
Compare Likhitha Infra. with Similar Stocks
Dashboard
Poor long term growth as Operating profit has grown by an annual rate -4.06% of over the last 5 years
The company has declared negative results for the last 4 consecutive quarters
Despite the size of the company, domestic mutual funds hold only 0% of the company
Underperformed the market in the last 1 year
Total Returns (Price + Dividend) 
Latest dividend: 1.5 per share ex-dividend date: Sep-20-2023
Risk Adjusted Returns v/s
Returns Beta

News
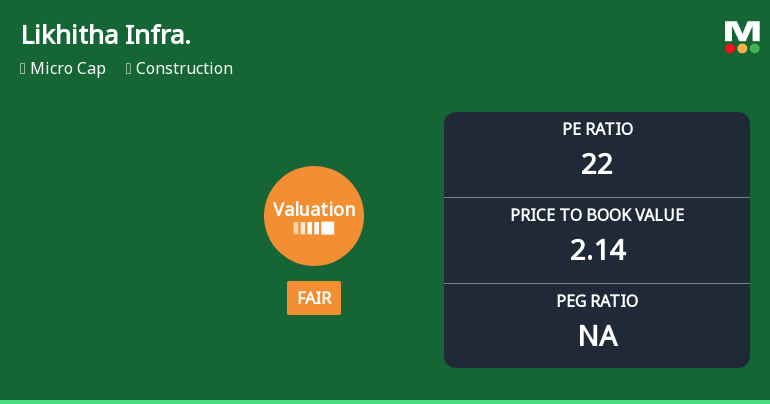
Likhitha Infrastructure Ltd Valuation Shifts Amid Mixed Market Performance
Likhitha Infrastructure Ltd, a micro-cap player in the construction sector, has experienced a notable shift in its valuation parameters, moving from a previously very attractive level to a fair valuation grade. This change comes amid mixed financial metrics and a volatile market backdrop, prompting a downgrade in its Mojo Grade from Hold to Sell as of 8 June 2026.
Read full news article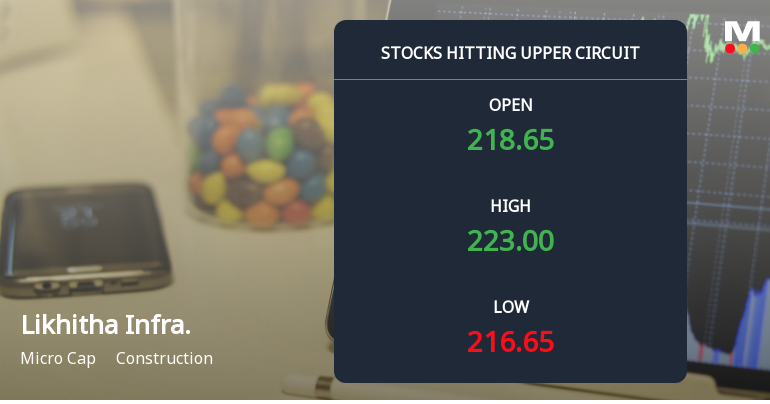
Likhitha Infrastructure Ltd Locks at Upper Circuit With 5% Gain — Buyers Queue, Sellers Absent
At Rs 227.2, the buying was done — not because demand dried up, but because the exchange wouldn't let the stock go any higher. Likhitha Infrastructure Ltd locked at its upper circuit of 5% on 8 Jun 2026, with buyers queuing and no sellers willing to part with shares.
Read full news article
Likhitha Infrastructure Ltd is Rated Sell
Likhitha Infrastructure Ltd is rated 'Sell' by MarketsMOJO, with this rating last updated on 27 March 2026. However, the analysis and financial metrics discussed here reflect the stock's current position as of 04 June 2026, providing investors with an up-to-date view of the company’s fundamentals, returns, and market performance.
Read full news article Announcements
Corporate Actions

No Upcoming Board Meetings

Likhitha Infrastructure Ltd has declared 30% dividend, ex-date: 20 Sep 23

Likhitha Infrastructure Ltd has announced 5:10 stock split, ex-date: 02 Dec 22

No Bonus history available

No Rights history available
Quality key factors
Valuation key factors
Technicals key factors
 Technical Indicator Scale: Bearish, Mildly Bearish, Sideways, Mildly Bullish, Bullish Turned
 Shareholding Snapshot : Mar 2026
Shareholding Compare (%holding)
Promoters
None
Held by 0 Schemes
Held by 6 FIIs (0.1%)
Srinivasa Rao Gaddipati (68.38%)
None
25.79%
Quarterly Results Snapshot (Consolidated) - Mar'26 - QoQ

QoQ Growth in quarter ended Mar 2026 is 8.34% vs 8.96% in Dec 2025
QoQ Growth in quarter ended Mar 2026 is -50.43% vs -19.62% in Dec 2025
Half Yearly Results Snapshot (Consolidated) - Sep'25
Growth in half year ended Sep 2025 is -13.03% vs 29.93% in Sep 2024
Growth in half year ended Sep 2025 is -26.41% vs 9.40% in Sep 2024
Nine Monthly Results Snapshot (Consolidated) - Dec'25
YoY Growth in nine months ended Dec 2025 is -12.34% vs 28.04% in Dec 2024
YoY Growth in nine months ended Dec 2025 is -32.82% vs 8.37% in Dec 2024
Annual Results Snapshot (Consolidated) - Mar'26
YoY Growth in year ended Mar 2026 is -12.18% vs 23.34% in Mar 2025
YoY Growth in year ended Mar 2026 is -43.46% vs 5.99% in Mar 2025
About Likhitha Infrastructure Ltd

Company Coordinates


