
Compare EMS with Similar Stocks
Dashboard
Poor long term growth as Net Sales has grown by an annual rate of -3.86% and Operating profit at -18.78% over the last 5 years
With a fall in Operating Profit of -35.74%, the company declared Very Negative results in Mar 26
With ROE of 8.6, it has a Very Expensive valuation with a 2.4 Price to Book Value
Despite the size of the company, domestic mutual funds hold only 0% of the company
Underperformed the market in the last 1 year
Stock DNA
Other Utilities
INR 2,363 Cr (Small Cap)
25.00
38
0.34%
0.09
8.58%
2.35
Total Returns (Price + Dividend) 
Latest dividend: 1.4989554317548748 per share ex-dividend date: Sep-19-2025
Risk Adjusted Returns v/s
Returns Beta

News
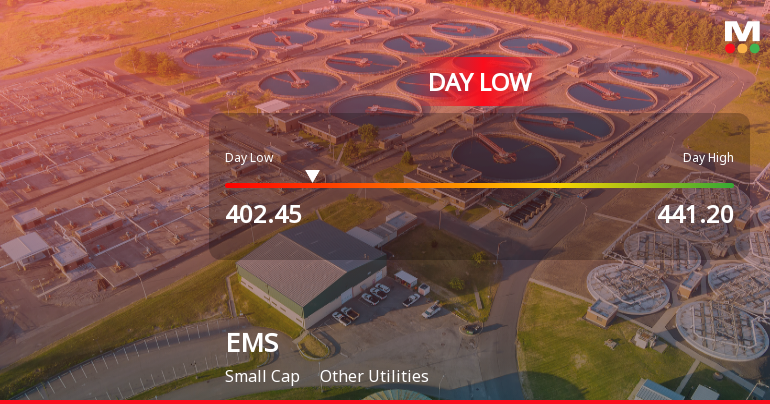
EMS Ltd Hits Intraday Low Amidst Notable Price Pressure on 24 Jun 2026
EMS Ltd experienced a notable intraday decline on 24 Jun 2026, touching a low of Rs 402.45, marking a 10.0% drop from previous levels. This downturn comes after eight consecutive days of gains, reflecting immediate price pressures despite broader market advances.
Read full news article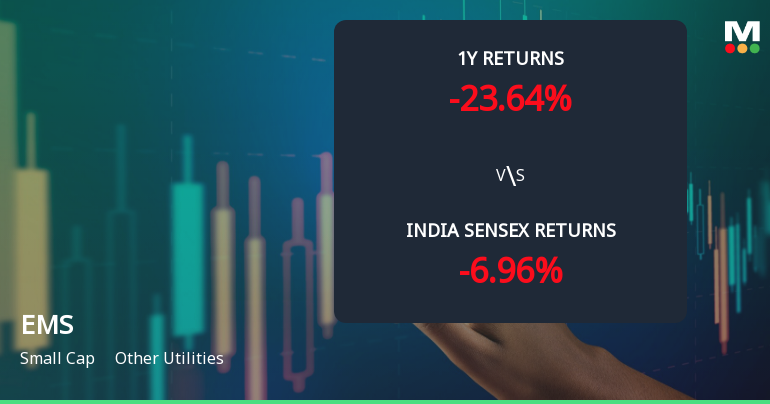
EMS Ltd Technical Momentum Shifts Amid Mixed Market Signals
EMS Ltd has exhibited a notable shift in price momentum, moving from a sideways trend to a mildly bullish stance on the weekly charts, despite mixed signals from key technical indicators. The stock’s recent surge of 9.52% in a single day to ₹447.15, up from the previous close of ₹408.30, has caught the attention of investors and analysts alike, prompting a detailed examination of its technical parameters and market context.
Read full news article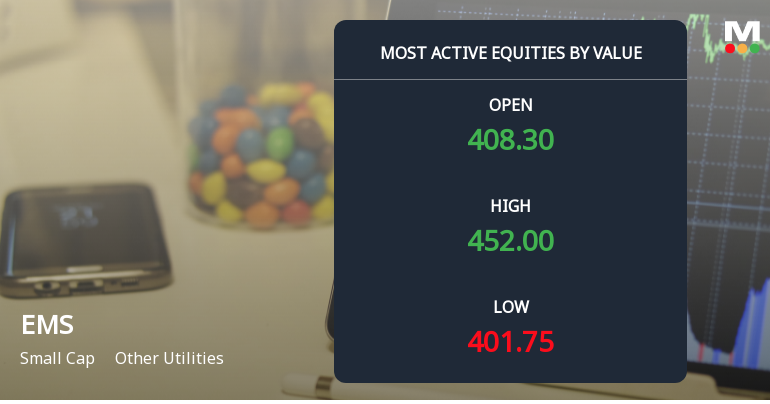
EMS Ltd Surges on High-Value Trading Amid Strong Institutional Interest
EMS Ltd, a small-cap player in the Other Utilities sector, has emerged as one of the most actively traded stocks by value on 23 June 2026, registering a robust 5.03% gain intraday and continuing a strong upward momentum that has seen the stock appreciate over 46% in the past eight trading sessions.
Read full news article Announcements
Clarification On Increase In Volume BSE Letter Dated June 18 2026
18-Jun-2026 | Source : BSEAs per PDF Attached
Clarification sought from EMS Ltd
18-Jun-2026 | Source : BSEThe Exchange has sought clarification from EMS Ltd on June 18 2026 with reference to Movement in Volume.
The reply is awaited.
Updates
17-Jun-2026 | Source : BSEClarification on Spurt in Volume
Corporate Actions

No Upcoming Board Meetings

EMS Ltd has declared 15% dividend, ex-date: 19 Sep 25

No Splits history available

No Bonus history available

No Rights history available
Quality key factors
Valuation key factors
Technicals key factors
 Technical Indicator Scale: Bearish, Mildly Bearish, Sideways, Mildly Bullish, Bullish Turned
 Shareholding Snapshot : Mar 2026
Shareholding Compare (%holding)
Promoters
21.9452
Held by 1 Schemes (0.0%)
Held by 8 FIIs (0.41%)
Ramveer Singh (67.85%)
None
25.89%
Quarterly Results Snapshot (Consolidated) - Mar'26 - QoQ

QoQ Growth in quarter ended Mar 2026 is -39.86% vs 15.49% in Dec 2025
QoQ Growth in quarter ended Mar 2026 is -70.31% vs -33.32% in Dec 2025
Half Yearly Results Snapshot (Consolidated) - Sep'25
Growth in half year ended Sep 2025 is -6.46% vs 26.19% in Sep 2024
Growth in half year ended Sep 2025 is -23.80% vs 27.70% in Sep 2024
Nine Monthly Results Snapshot (Consolidated) - Dec'25
YoY Growth in nine months ended Dec 2025 is -10.70% vs 25.00% in Dec 2024
YoY Growth in nine months ended Dec 2025 is -38.11% vs 30.39% in Dec 2024
Annual Results Snapshot (Consolidated) - Mar'26
YoY Growth in year ended Mar 2026 is -24.65% vs 22.59% in Mar 2025
YoY Growth in year ended Mar 2026 is -50.68% vs 20.45% in Mar 2025
About EMS Ltd

Company Coordinates


