
Compare Gandhar Oil Ref. with Similar Stocks
Total Returns (Price + Dividend) 
Latest dividend: 0.7390133333333334 per share ex-dividend date: Jan-30-2026
Risk Adjusted Returns v/s
Returns Beta

News

Broad-Based Technical Strength Lifts Gandhar Oil Refinery (India) Ltd to 52-Week High of Rs 184.95
With a decisive surge to Rs 184.95 on 23 Jun 2026, Gandhar Oil Refinery (India) Ltd has reached a fresh 52-week high, outperforming its sector by 3.11% and demonstrating robust technical momentum across multiple timeframes.
Read full news article
Broad-Based Technical Strength Lifts Gandhar Oil Refinery (India) Ltd to 52-Week High of Rs 184.95
With a decisive intraday surge to Rs 184.95 on 23 Jun 2026, Gandhar Oil Refinery (India) Ltd has reached a fresh 52-week high, marking a significant milestone in its price momentum. This advance comes amid a backdrop of strong technical signals and sustained outperformance relative to its sector and the broader market.
Read full news article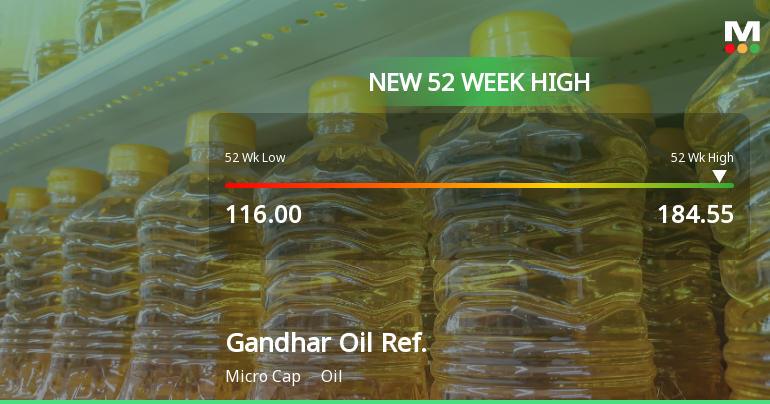
Broad-Based Technical Strength Lifts Gandhar Oil Refinery (India) Ltd to 52-Week High of Rs 184.55
With a decisive surge to Rs 184.55 on 19 Jun 2026, Gandhar Oil Refinery (India) Ltd has reached a fresh 52-week high, marking a notable milestone in its price momentum. This rally comes amid a backdrop of strong technical signals and sustained upward movement across multiple timeframes, setting the stage for a compelling momentum narrative.
Read full news article Announcements
Intimation In Terms Of Regulation 30 Of The Securities And Exchange Board Of India (Listing Obligations And Disclosure Requirements) Regulations 2015 (Listing Regulations) Clarification On Increase In Volume Of Security Across Exchanges Sought By BSE Vid
19-Jun-2026 | Source : BSEIntimation in terms of Regulation 30 of SEBI (LODR) Regulations 2015 Clarification on increase in volume of security across exchanges sought by BSE vide letter bearing Ref No.: L/SURV/ONL/PV/SG/2026-2027/162 dated June 19 2026.
Clarification On Increase In Volume Of Security Across Exchanges Sought By NSE Vide Letter Bearing Ref. No.: NSE/CM/Surveillance/17122 Dated June 18 2026
19-Jun-2026 | Source : BSEClarification on increase in volume of security across exchanges sought by NSE vide letter bearing Ref No.: NSE/CM/Surveillance/17122 dated June 18 2026.
Clarification sought from Gandhar Oil Refinery (India) Ltd
19-Jun-2026 | Source : BSEThe Exchange has sought clarification from Gandhar Oil Refinery (India) Ltd on June 19 2026 with reference to Movement in Volume.
The reply is awaited.
Corporate Actions

No Upcoming Board Meetings

Gandhar Oil Refinery (India) Ltd has declared 37% dividend, ex-date: 30 Jan 26

No Splits history available

No Bonus history available

No Rights history available
Quality key factors
Valuation key factors
Technicals key factors
 Technical Indicator Scale: Bearish, Mildly Bearish, Sideways, Mildly Bullish, Bullish Turned
 Shareholding Snapshot : Mar 2026
Shareholding Compare (%holding)
Promoters
None
Held by 0 Schemes
Held by 10 FIIs (0.14%)
Ramesh Babulal Parekh (28.62%)
Bandhan Amc Limited (2.25%)
26.27%
Quarterly Results Snapshot (Consolidated) - Mar'26 - QoQ

QoQ Growth in quarter ended Mar 2026 is -6.31% vs 10.11% in Dec 2025

QoQ Growth in quarter ended Mar 2026 is 25.59% vs -10.15% in Dec 2025
Half Yearly Results Snapshot (Consolidated) - Sep'25
Growth in half year ended Sep 2025 is 1.71% vs -6.83% in Sep 2024
Growth in half year ended Sep 2025 is 27.02% vs -41.67% in Sep 2024
Nine Monthly Results Snapshot (Consolidated) - Dec'25
YoY Growth in nine months ended Dec 2025 is 6.63% vs -7.52% in Dec 2024
YoY Growth in nine months ended Dec 2025 is 38.49% vs -47.97% in Dec 2024
Annual Results Snapshot (Consolidated) - Mar'26
YoY Growth in year ended Mar 2026 is 8.83% vs -5.26% in Mar 2025
YoY Growth in year ended Mar 2026 is 69.09% vs -43.03% in Mar 2025
About Gandhar Oil Refinery (India) Ltd

Company Coordinates


