
Compare RBZ Jewellers Lt with Similar Stocks
Dashboard
Flat results in Mar 26
- INTEREST(9M) At Rs 11.49 cr has Grown at 44.17%
- PBT LESS OI(Q) At Rs 15.80 cr has Fallen at -8.4% (vs previous 4Q average)
- PAT(Q) At Rs 11.68 cr has Fallen at -9.6% (vs previous 4Q average)
Despite the size of the company, domestic mutual funds hold only 0% of the company
Stock DNA
Gems, Jewellery And Watches
INR 534 Cr (Micro Cap)
10.00
48
0.00%
0.55
20.24%
1.98
Total Returns (Price + Dividend) 
RBZ Jewellers Lt for the last several years.
Risk Adjusted Returns v/s
Returns Beta

News

RBZ Jewellers Ltd Technical Momentum Shifts Amid Mixed Market Signals
RBZ Jewellers Ltd has experienced a notable shift in its technical momentum, moving from a sideways trend to a mildly bearish stance, reflecting a complex interplay of technical indicators. Despite a recent downgrade to a Sell rating by MarketsMOJO, the stock exhibits mixed signals across key momentum and trend indicators, suggesting cautious investor sentiment amid sectoral and market headwinds.
Read full news article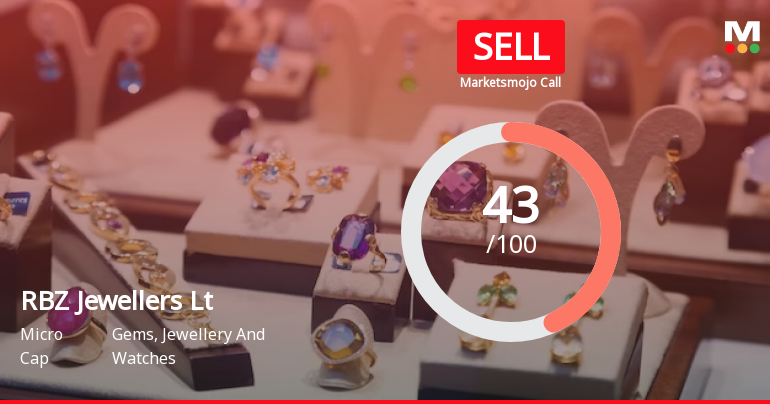
RBZ Jewellers Ltd is Rated Sell
RBZ Jewellers Ltd is rated 'Sell' by MarketsMOJO, with this rating last updated on 13 May 2026. However, the analysis and financial metrics presented here reflect the stock's current position as of 16 June 2026, providing investors with the most up-to-date view of the company's fundamentals, returns, and technical outlook.
Read full news article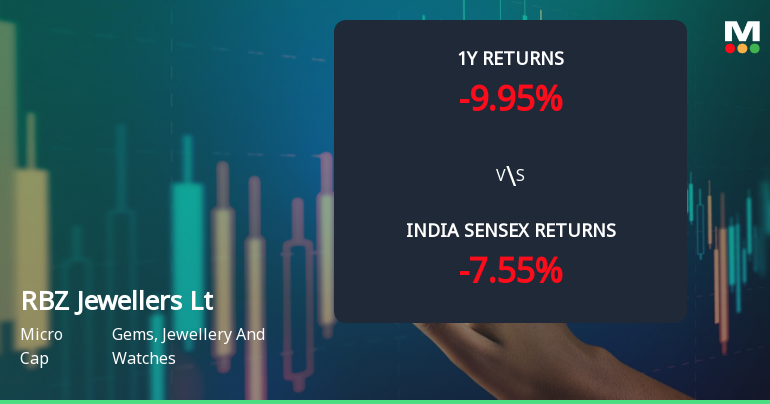
RBZ Jewellers Ltd Technical Momentum Shifts Amid Mixed Market Signals
RBZ Jewellers Ltd has experienced a notable shift in its technical momentum, moving from a mildly bearish stance to a sideways trend, reflecting a complex interplay of bullish and bearish signals across key indicators. Despite a 3.47% gain in the latest session, the micro-cap stock remains under pressure with a MarketsMOJO Mojo Score of 43.0 and a recent downgrade from Hold to Sell, signalling caution for investors in the Gems, Jewellery and Watches sector.
Read full news article Announcements
Announcement under Regulation 30 (LODR)-Analyst / Investor Meet - Intimation
08-Jun-2026 | Source : BSEWe hereby submit the intimation of participation of Company in Virtual Investor Conference with Choice Institutional Equities schedule to be held on 11th June 2026. Kindly take the same on your record.
Compliances-Reg.24(A)-Annual Secretarial Compliance
30-May-2026 | Source : BSEPursuant to Reg24A of SEBI LODR 2015 read with relevant circulars issued by SEBI from time to time please find enclosed Annual Secretarial Compliance Report for the financial year ended as on 31st March 2026 issued by Secretarial Auditor Mr. Neel R Shah Practising Company Secretary. Kindly take the same on your record.
Announcement under Regulation 30 (LODR)-Earnings Call Transcript
19-May-2026 | Source : BSEWe herewith submit the Transcript of Earnings call held on 15th May 2026 at 4.30 pm.
Corporate Actions

No Upcoming Board Meetings

No Dividend history available

No Splits history available

No Bonus history available

No Rights history available
Quality key factors
Valuation key factors
Technicals key factors
 Technical Indicator Scale: Bearish, Mildly Bearish, Sideways, Mildly Bullish, Bullish Turned
 Shareholding Snapshot : Mar 2026
Shareholding Compare (%holding)
Promoters
None
Held by 0 Schemes
Held by 0 FIIs
Rajendrakumar Kantilal Zaveri (38.23%)
Ashika Global Finance Private Limited (2.71%)
19.86%
Quarterly Results Snapshot (Standalone) - Mar'26 - QoQ

QoQ Growth in quarter ended Mar 2026 is -16.28% vs 56.00% in Dec 2025
QoQ Growth in quarter ended Mar 2026 is -32.99% vs -6.09% in Dec 2025
Half Yearly Results Snapshot (Standalone) - Sep'25
Growth in half year ended Sep 2025 is 10.87% vs 58.65% in Sep 2024

Growth in half year ended Sep 2025 is 49.88% vs 41.77% in Sep 2024
Nine Monthly Results Snapshot (Standalone) - Dec'25
YoY Growth in nine months ended Dec 2025 is 13.78% vs 62.83% in Dec 2024
YoY Growth in nine months ended Dec 2025 is 42.64% vs 60.20% in Dec 2024
Annual Results Snapshot (Standalone) - Mar'26
YoY Growth in year ended Mar 2026 is 20.06% vs 61.90% in Mar 2025
YoY Growth in year ended Mar 2026 is 41.24% vs 79.88% in Mar 2025
About RBZ Jewellers Ltd

Company Coordinates


