
Compare Exicom Tele-Sys. with Similar Stocks
Dashboard
Weak Long Term Fundamental Strength with an average Return on Capital Employed (ROCE) of 0%
- Poor long term growth as Operating profit has grown by an annual rate -253.25% of over the last 5 years
- Low ability to service debt as the company has a high Debt to EBITDA ratio of -6.90 times
Risky - Negative EBITDA
Reducing Promoter Confidence
Stock DNA
Heavy Electrical Equipment
INR 2,218 Cr (Micro Cap)
NA (Loss Making)
43
0.00%
1.00
-39.55%
3.46
Total Returns (Price + Dividend) 
Exicom Tele-Sys. for the last several years.
Risk Adjusted Returns v/s
Returns Beta

News
Exicom Tele-Systems Ltd is Rated Sell
Exicom Tele-Systems Ltd is rated 'Sell' by MarketsMOJO, with this rating last updated on 11 June 2026. However, the analysis and financial metrics discussed here reflect the stock's current position as of 26 July 2026, providing investors with an up-to-date view of the company’s fundamentals, valuation, financial trends, and technical outlook.
Read full news article
Exicom Tele-Systems Ltd is Rated Sell
Exicom Tele-Systems Ltd is rated 'Sell' by MarketsMOJO, with this rating last updated on 11 June 2026. However, the analysis and financial metrics discussed here reflect the stock's current position as of 15 July 2026, providing investors with an up-to-date view of the company’s fundamentals, valuation, financial trends, and technical outlook.
Read full news article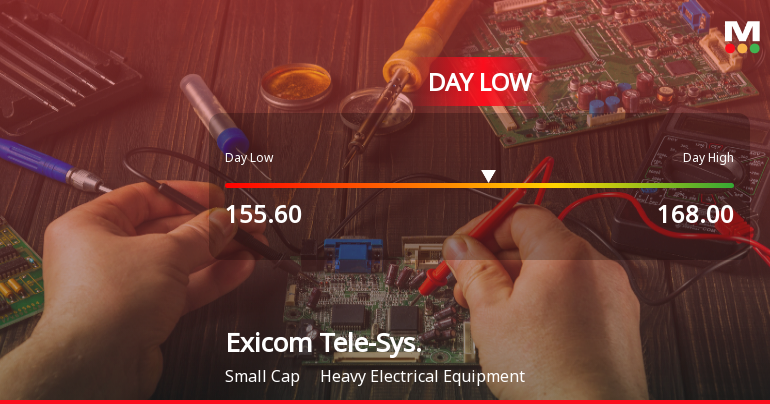
Exicom Tele-Systems Ltd Hits Intraday Low Amid Price Pressure on 14 Jul 2026
Exicom Tele-Systems Ltd experienced a significant intraday decline on 14 Jul 2026, touching a low of Rs 155.6, down 7.93% from the previous close. The stock underperformed its sector and the broader market, reflecting immediate selling pressure and subdued market sentiment.
Read full news article Announcements
Compliances-Certificate under Reg. 74 (5) of SEBI (DP) Regulations 2018
07-Jul-2026 | Source : BSECertificate under Regulation 74(5) of SEBI (Depositories and Participants) Regulations 2018 for the quarter ended on June 30 2026.
Announcement under Regulation 30 (LODR)-Change in Management
26-Jun-2026 | Source : BSEIntimation of resignation of Mr. Aman Sharma- Head of IT & Applications (Senior Management Personnel) effective from June 30 2026.
Closure of Trading Window
24-Jun-2026 | Source : BSEIntimation regarding closure of trading window
Corporate Actions

No Upcoming Board Meetings

No Dividend history available

No Splits history available

No Bonus history available

Exicom Tele-Systems Ltd has announced 3:20 rights issue, ex-date: 07 Jul 25
Quality key factors
Valuation key factors
Technicals key factors
 Technical Indicator Scale: Bearish, Mildly Bearish, Sideways, Mildly Bullish, Bullish Turned
 Shareholding Snapshot : Jun 2026
Shareholding Compare (%holding)
Promoters
2.8305
Held by 1 Schemes (0.25%)
Held by 10 FIIs (0.2%)
Nextwave Communications Private Limited (54.72%)
Belgrave Investment Fund (3.74%)
26.05%
Quarterly Results Snapshot (Consolidated) - Mar'26 - QoQ

QoQ Growth in quarter ended Mar 2026 is 40.19% vs -1.77% in Dec 2025
QoQ Growth in quarter ended Mar 2026 is 19.98% vs 1.37% in Dec 2025
Half Yearly Results Snapshot (Consolidated) - Sep'25
Growth in half year ended Sep 2025 is 20.12% vs -10.90% in Sep 2024

Growth in half year ended Sep 2025 is -12,657.85% vs -95.59% in Sep 2024
Nine Monthly Results Snapshot (Consolidated) - Dec'25
YoY Growth in nine months ended Dec 2025 is 26.86% vs -16.23% in Dec 2024
YoY Growth in nine months ended Dec 2025 is -360.26% vs -231.03% in Dec 2024
Annual Results Snapshot (Consolidated) - Mar'26
YoY Growth in year ended Mar 2026 is 32.75% vs -14.91% in Mar 2025
YoY Growth in year ended Mar 2026 is -149.14% vs -272.14% in Mar 2025
About Exicom Tele-Systems Ltd

Company Coordinates


