
Compare Emcure Pharma with Similar Stocks
Dashboard
High Management Efficiency with a high ROCE of 21.82%
Strong ability to service debt as the company has a low Debt to EBITDA ratio of 0.84 times
Healthy long term growth as Net Sales has grown by an annual rate of 15.40% and Operating profit at 16.32%
Flat results in Mar 26
With ROCE of 22.8, it has a Very Expensive valuation with a 5.9 Enterprise value to Capital Employed
Increasing Participation by Institutional Investors
Stock DNA
Pharmaceuticals & Biotechnology
INR 36,203 Cr (Small Cap)
38.00
37
0.16%
0.28
19.15%
7.36
Total Returns (Price + Dividend) 
Latest dividend: 2.9999999999999996 per share ex-dividend date: Aug-14-2025
Risk Adjusted Returns v/s
Returns Beta

News
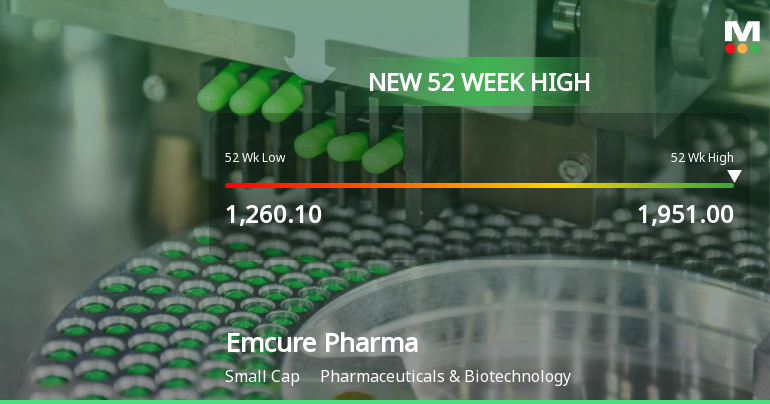
Broad-Based Technical Strength Lifts Emcure Pharmaceuticals Ltd to 52-Week High of Rs 1957.8
With a decisive break above Rs 1957.8 on 28 Jul 2026, Emcure Pharmaceuticals Ltd has reached a fresh 52-week and all-time high, propelled by a confluence of bullish technical indicators and sustained price momentum.
Read full news article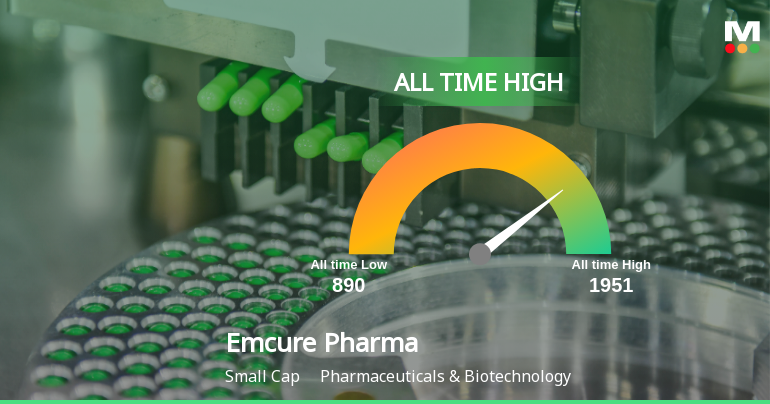

Emcure Pharmaceuticals Ltd is Rated Hold
Emcure Pharmaceuticals Ltd is rated 'Hold' by MarketsMOJO, with this rating last updated on 05 May 2026. However, the analysis and financial metrics discussed here reflect the stock's current position as of 25 July 2026, providing investors with an up-to-date perspective on the company’s performance and outlook.
Read full news article Announcements
Intimation Under Regulation 30 Of The SEBI (Listing Obligations And Disclosure Requirements) Regulations 2015 - Update On Completion Of Acquisition Of Shares Of Gennova Biopharmaceuticals Limited.
22-Jul-2026 | Source : BSEUpdate on completion of acquisition of shares of Gennova Biopharmaceuticals Limited
Announcement under Regulation 30 (LODR)-Change in Management
21-Jul-2026 | Source : BSEIntimation under Regulation 30 of the SEBI (LODR) Regulations 2015 - Completion of 2nd term of Independent Director
Announcement under Regulation 30 (LODR)-Press Release / Media Release
20-Jul-2026 | Source : BSEPress Release titled Emcure to Expand the Use of Poviztra for MASH Indication Following CDSCO Approval.
Corporate Actions

06 Aug 2026

Emcure Pharmaceuticals Ltd has declared 30% dividend, ex-date: 14 Aug 25

No Splits history available

No Bonus history available

No Rights history available
Quality key factors
Valuation key factors
Technicals key factors
 Technical Indicator Scale: Bearish, Mildly Bearish, Sideways, Mildly Bullish, Bullish Turned
 Shareholding Snapshot : Jun 2026
Shareholding Compare (%holding)
Promoters
0.0406
Held by 23 Schemes (6.87%)
Held by 116 FIIs (4.88%)
Satish R Mehta (39.75%)
Kotak Midcap Fund (1.93%)
6.45%
Quarterly Results Snapshot (Consolidated) - Mar'26 - QoQ

QoQ Growth in quarter ended Mar 2026 is 4.49% vs 4.13% in Dec 2025
QoQ Growth in quarter ended Mar 2026 is 5.58% vs -5.31% in Dec 2025
Half Yearly Results Snapshot (Consolidated) - Sep'25

Growth in half year ended Sep 2025 is 14.49% vs 18.57% in Sep 2024
Growth in half year ended Sep 2025 is 33.00% vs 25.63% in Sep 2024
Nine Monthly Results Snapshot (Consolidated) - Dec'25
YoY Growth in nine months ended Dec 2025 is 16.51% vs 18.27% in Dec 2024
YoY Growth in nine months ended Dec 2025 is 38.30% vs 28.55% in Dec 2024
Annual Results Snapshot (Consolidated) - Mar'26
YoY Growth in year ended Mar 2026 is 16.56% vs 18.59% in Mar 2025
YoY Growth in year ended Mar 2026 is 35.67% vs 36.76% in Mar 2025
About Emcure Pharmaceuticals Ltd

Company Coordinates


