
Compare Emcure Pharma with Similar Stocks
Dashboard
High Management Efficiency with a high ROCE of 21.82%
Strong ability to service debt as the company has a low Debt to EBITDA ratio of 0.84 times
Healthy long term growth as Net Sales has grown by an annual rate of 15.40% and Operating profit at 16.32%
Flat results in Mar 26
With ROCE of 22.8, it has a Very Expensive valuation with a 5.8 Enterprise value to Capital Employed
Majority shareholders : Promoters
Market Beating Performance
Stock DNA
Pharmaceuticals & Biotechnology
INR 36,157 Cr (Small Cap)
38.00
35
0.16%
0.28
19.15%
7.09
Total Returns (Price + Dividend) 
Latest dividend: 2.9999999999999996 per share ex-dividend date: Aug-14-2025
Risk Adjusted Returns v/s
Returns Beta

News
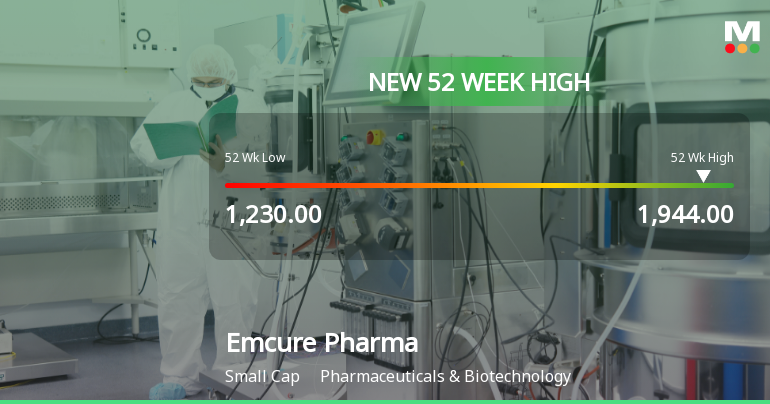
Broad-Based Technical Strength Lifts Emcure Pharmaceuticals Ltd to 52-Week High of Rs 1944
Surging past its previous peaks, Emcure Pharmaceuticals Ltd touched a fresh 52-week high of Rs 1944 on 25 Jun 2026, marking a significant milestone in its price momentum. This rally has been fuelled by a confluence of strong technical signals and sustained buying interest, setting the stage for continued market attention.
Read full news article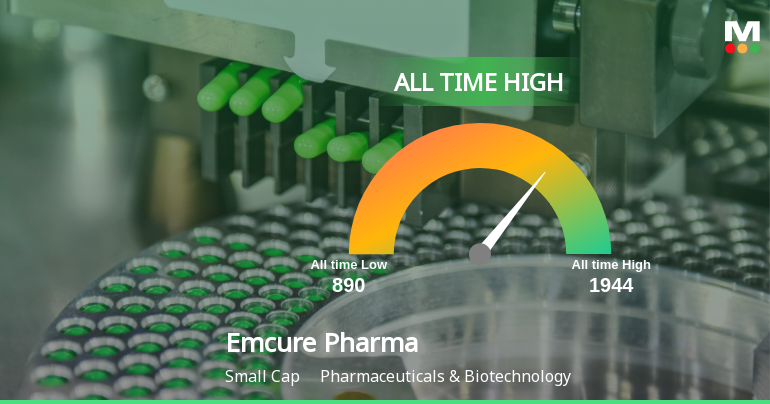
Emcure Pharmaceuticals Ltd Hits All-Time High of Rs 1,944 as Momentum Builds Across Timeframes
Extending a six-day winning streak, Emcure Pharmaceuticals Ltd surged to a fresh all-time high of Rs 1,944 on 25 Jun 2026, outpacing the broader Sensex by a wide margin and reinforcing its bullish momentum across multiple timeframes.
Read full news article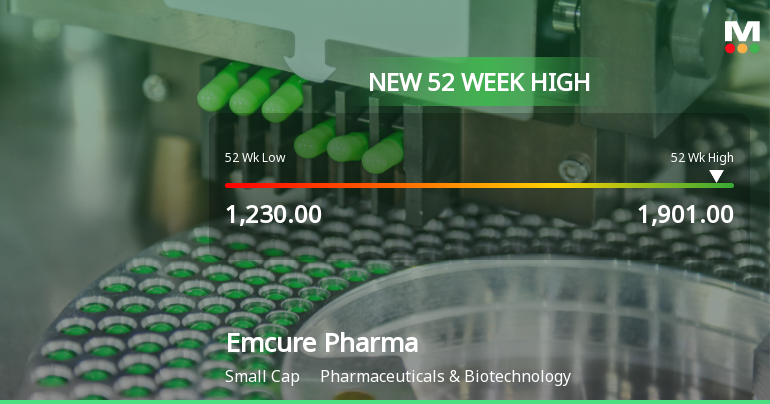
Broad-Based Technical Strength Lifts Emcure Pharmaceuticals Ltd to 52-Week High of Rs 1901
Surging past its previous peaks, Emcure Pharmaceuticals Ltd reached a fresh 52-week high of Rs 1901 on 23 Jun 2026, marking a significant milestone in its price journey. This advance comes amid a sustained four-day rally that has propelled the stock up by 9.42%, outpacing its sector by 3.71% on the day.
Read full news article Announcements
Announcement under Regulation 30 (LODR)-Allotment of ESOP / ESPS
19-Jun-2026 | Source : BSEAllotment of 20600 Equity Shares pursuant to exercise of ESOPs under Emcure - Employee Stock Option Scheme 2013
Announcement under Regulation 30 (LODR)-Investor Presentation
12-Jun-2026 | Source : BSEIntimation under Regulation 30 of the SEBI (Listing Obligations and Disclosure Requirements) Regulations 2015 - Investor Presentation - June 2026
Compliances-Reg.24(A)-Annual Secretarial Compliance
27-May-2026 | Source : BSEAnnual Secretarial Compliance Report for the Financial Year ended March 31 2026
Corporate Actions

No Upcoming Board Meetings

Emcure Pharmaceuticals Ltd has declared 30% dividend, ex-date: 14 Aug 25

No Splits history available

No Bonus history available

No Rights history available
Quality key factors
Valuation key factors
Technicals key factors
 Technical Indicator Scale: Bearish, Mildly Bearish, Sideways, Mildly Bullish, Bullish Turned
 Shareholding Snapshot : Mar 2026
Shareholding Compare (%holding)
Promoters
0.0406
Held by 21 Schemes (4.94%)
Held by 95 FIIs (3.35%)
Satish R Mehta (39.77%)
Bc Investments Iv Limited (3.87%)
6.46%
Quarterly Results Snapshot (Consolidated) - Mar'26 - QoQ

QoQ Growth in quarter ended Mar 2026 is 4.49% vs 4.13% in Dec 2025
QoQ Growth in quarter ended Mar 2026 is 5.58% vs -5.31% in Dec 2025
Half Yearly Results Snapshot (Consolidated) - Sep'25

Growth in half year ended Sep 2025 is 14.49% vs 18.57% in Sep 2024
Growth in half year ended Sep 2025 is 33.00% vs 25.63% in Sep 2024
Nine Monthly Results Snapshot (Consolidated) - Dec'25
YoY Growth in nine months ended Dec 2025 is 16.51% vs 18.27% in Dec 2024
YoY Growth in nine months ended Dec 2025 is 38.30% vs 28.55% in Dec 2024
Annual Results Snapshot (Consolidated) - Mar'26
YoY Growth in year ended Mar 2026 is 16.56% vs 18.59% in Mar 2025
YoY Growth in year ended Mar 2026 is 35.67% vs 36.76% in Mar 2025
About Emcure Pharmaceuticals Ltd

Company Coordinates


