
Compare Wockhardt with Similar Stocks
Dashboard
Weak Long Term Fundamental Strength with an average Return on Capital Employed (ROCE) of 2.09%
- Poor long term growth as Net Sales has grown by an annual rate of 4.49% over the last 5 years
- Company's ability to service its debt is weak with a poor EBIT to Interest (avg) ratio of 0.32
With a growth in Net Profit of 168.85%, the company declared Outstanding results in Mar 26
With ROCE of 6.5, it has a Very Expensive valuation with a 5 Enterprise value to Capital Employed
Falling Participation by Institutional Investors
Stock DNA
Pharmaceuticals & Biotechnology
INR 30,955 Cr (Small Cap)
103.00
27
0.00%
0.32
6.07%
6.27
Total Returns (Price + Dividend) 
Latest dividend: 10 per share ex-dividend date: Nov-17-2016
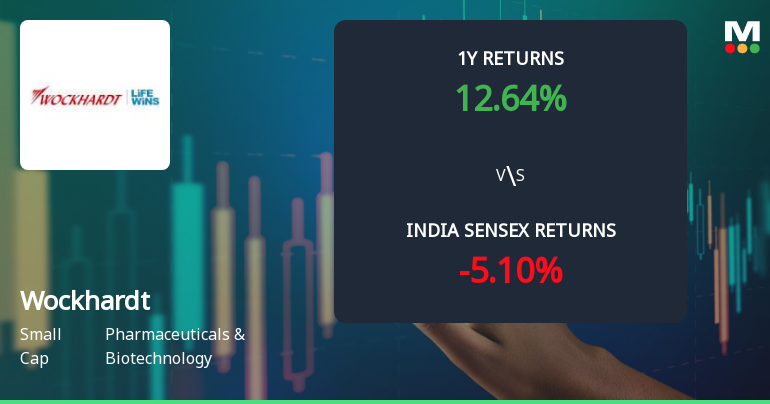
Risk Adjusted Returns v/s
Returns Beta

News
Wockhardt Ltd Technical Momentum Shifts Signal Bullish Outlook Amid Mixed Indicators
Wockhardt Ltd has witnessed a notable shift in its technical momentum, moving from a mildly bullish stance to a more confident bullish trend. This change is underscored by a blend of mixed signals from key technical indicators such as MACD, RSI, and moving averages, reflecting a nuanced outlook for the pharmaceutical and biotechnology company amid evolving market dynamics.
Read full news article
Wockhardt Ltd is Rated Hold
Wockhardt Ltd is rated 'Hold' by MarketsMOJO, with this rating last updated on 18 May 2026. However, the analysis and financial metrics discussed here reflect the company’s current position as of 24 July 2026, providing investors with an up-to-date view of its fundamentals, returns, and market standing.
Read full news article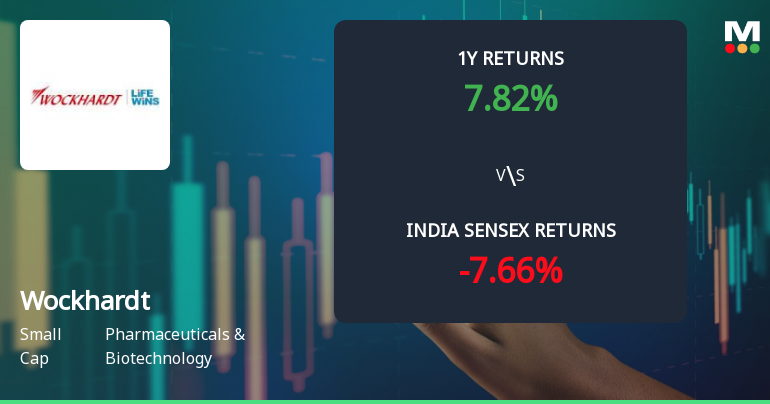
Wockhardt Ltd Technical Momentum Shifts Amid Mixed Indicator Signals
Wockhardt Ltd, a small-cap player in the Pharmaceuticals & Biotechnology sector, has experienced a nuanced shift in its technical momentum, moving from a bullish to a mildly bullish stance. Despite a slight dip in its daily price, the stock’s mixed signals from key technical indicators such as MACD, RSI, and moving averages suggest a complex market sentiment that investors should carefully analyse.
Read full news article Announcements
Wockhardt Limited - Other General Purpose
03-Dec-2019 | Source : NSEWockhardt Limited has informed the Exchange regarding Disclosure of Related Party Transactions pursuant to Regulation 23(9) of the SEBI ( LODR) Regulations, 2015. (SEBI Listing Regulations)
Wockhardt Limited - Updates
13-Nov-2019 | Source : NSEWockhardt Limited has informed the Exchange regarding 'extract of Unaudited Consolidated Financial Results for the quarter and half year ended 30th September, 2019 published in the newspaper in relation to Results got approved in the Board Meeting held on 7th November, 2019'.
Wockhardt Limited - ESOP/ESOS/ESPS
08-Nov-2019 | Source : NSEWockhardt Limited has informed the Exchange regarding Grant of 76000 Options.
Corporate Actions

No Upcoming Board Meetings

Wockhardt Ltd has declared 200% dividend, ex-date: 17 Nov 16

No Splits history available

No Bonus history available

Wockhardt Ltd has announced 3:10 rights issue, ex-date: 08 Mar 22
Quality key factors
Valuation key factors
Technicals key factors
 Technical Indicator Scale: Bearish, Mildly Bearish, Sideways, Mildly Bullish, Bullish Turned
 Shareholding Snapshot : Jun 2026
Shareholding Compare (%holding)
Promoters
14.6806
Held by 25 Schemes (6.79%)
Held by 130 FIIs (7.22%)
Themisto Trustee Company Private Limited (40.15%)
Tata Mutual Fund - Tata Small Cap Fund (2.03%)
27.31%
Quarterly Results Snapshot (Consolidated) - Mar'26 - QoQ

QoQ Growth in quarter ended Mar 2026 is 8.67% vs 13.55% in Dec 2025

QoQ Growth in quarter ended Mar 2026 is 181.36% vs -24.36% in Dec 2025
Half Yearly Results Snapshot (Consolidated) - Sep'25
Growth in half year ended Sep 2025 is -1.81% vs 10.81% in Sep 2024
Growth in half year ended Sep 2025 is 66.67% vs 82.94% in Sep 2024
Nine Monthly Results Snapshot (Consolidated) - Dec'25
YoY Growth in nine months ended Dec 2025 is 6.13% vs 8.15% in Dec 2024
YoY Growth in nine months ended Dec 2025 is 313.64% vs 92.52% in Dec 2024
Annual Results Snapshot (Consolidated) - Mar'26
YoY Growth in year ended Mar 2026 is 11.99% vs 7.65% in Mar 2025
YoY Growth in year ended Mar 2026 is 553.19% vs 89.85% in Mar 2025
About Wockhardt Ltd

Company Coordinates


