Baazar Style

  • Market Cap: Small Cap
  • Industry: Garments & Apparels
  • ISIN: INE01FR01028
  • NSEID: STYLEBAAZA
  • BSEID: 544243
INR
276.75
-5.35 (-1.9%)
BSENSE

Dec 05

BSE+NSE Vol: 1.17 lacs

  • Price Points
  • Score
  • Mojo Parameters
  • Total Return
  • News and Corporate Actions
  • Key factors
  • Shareholding
  • Financials
  • CompanyCV
stock-summaryPrice Point
High/Low

1Day

52 Week

Valuation
Technical
Day's Volume

CASH

1.17 lacs (150.66%) Volume

Shareholding (Sep 2025)

FII

3.13%

Held by 22 FIIs

DII

2.14%

Held by 9 DIIs

Promoter

45.71%

Who are the top shareholders of the Baazar Style?

06-Jun-2025

The top shareholders of Baazar Style include promoter Bhagwan Prasad with 5.9%, public shareholder Dinesh Agarwal (HUF) at 4.12%, mutual funds with 7.05%, 14 foreign institutional investors holding 2.53%, and individual investors comprising 25.91% of total holdings.

The top shareholders of Baazar Style include the promoters, who hold the majority of the shares. The promoter with the highest holding is Bhagwan Prasad, who owns 5.9% of the company. Additionally, Dinesh Agarwal (HUF) is the highest public shareholder, holding 4.12%. The company also has mutual funds involved through six schemes, which collectively hold 7.05%, and 14 foreign institutional investors (FIIs) that hold 2.53%. Individual investors account for 25.91% of the total holdings.

Read More

What does Baazar Style do?

06-Jun-2025

Baazar Style Retail Ltd is a Small Cap company in the Garments & Apparels industry, reporting net sales of 345 Cr and a net loss of 6 Cr for the quarter ending March 2025. It has a market cap of Rs 1,921 Cr, a P/E ratio of 83.00, and a debt-equity ratio of 1.72.

Overview:<BR>Baazar Style Retail Ltd operates in the Garments & Apparels industry and is categorized as a Small Cap company.<BR><BR>History:<BR>The company was incorporated in 2013 as Dwarkadas Mohanlal Private Limited and later changed its name to Baazar Style Retail Private Limited. The latest quarterly results reported net sales and profit for the period ending March 2025.<BR><BR>Financial Snapshot:<BR>Net Sales: 345 Cr (Quarterly Results - Mar 2025) <BR>Net Profit: -6 Cr (Quarterly Results - Mar 2025) <BR>Market Cap: Rs 1,921 Cr (Small Cap)<BR><BR>Key Metrics:<BR>P/E: 83.00 <BR>Industry P/E: 99 <BR>Dividend Yield: 0.00% <BR>Debt-Equity: 1.72 <BR>Return on Equity: 6.08% <BR>Price to Book: 5.03 <BR><BR>Contact Details:<BR>Details: No Company Details Available <BR>Registrar Address: Not available.

Read More

Has Baazar Style declared dividend?

06-Jun-2025

No Dividend History Available

Is Baazar Style overvalued or undervalued?

09-Jun-2025

As of April 23, 2025, Baazar Style is considered undervalued with a valuation grade of very attractive, featuring a PE ratio of 83.99, an EV to EBITDA of 13.66, and a ROCE of 8.70%, which is lower than its peers, despite a year-to-date stock performance lagging behind the Sensex.

As of 23 April 2025, the valuation grade for Baazar Style has moved from fair to very attractive, indicating a significant improvement in its perceived value. The company is currently assessed as undervalued. Key financial ratios include a PE ratio of 83.99, an EV to EBITDA of 13.66, and a ROCE of 8.70%. <BR><BR>In comparison to its peers, Baazar Style's PE ratio is lower than Avenue Supermarts Ltd. at 100.87 and Trent Ltd. at 132.74, both of which are classified as very expensive. Additionally, Medplus Health, another very attractive peer, has a PE ratio of 72.98, further supporting Baazar Style's undervaluation. Despite recent stock performance lagging behind the Sensex, with a year-to-date return of -15.83% compared to the Sensex's 5.54%, the underlying valuation metrics suggest that Baazar Style presents a compelling investment opportunity.

Read More

Who are the peers of the Baazar Style?

16-Jul-2025

Baazar Style's peers include Sangam India, Sai Silks, City Pulse Multi, Cantabil Retail, Dollar Industrie, Nitin Spinners, SP Apparels, Himatsing. Seide, and Rupa & Co. Notable performance includes City Pulse Multi with a 614.54% 1-year return, while Dollar Industrie has the lowest at -24.39%.

Peers: The peers of Baazar Style are Sangam India, Sai Silks, City Pulse Multi, Cantabil Retail, Dollar Industrie, Nitin Spinners, SP Apparels, Himatsing. Seide, and Rupa & Co.<BR><BR>Quality Snapshot: Excellent management risk is observed at Nitin Spinners and SP Apparels, while Average management risk is found at Sangam India, Sai Silks, Cantabil Retail, Himatsing. Seide, and Rupa & Co, and the rest. Good growth is seen at Sai Silks and Nitin Spinners, while Excellent growth is noted for Baazar Style, and the rest have Below Average or Average growth. Capital Structure is Excellent for Dollar Industrie, Good for Sai Silks and SP Apparels, Average for City Pulse Multi, Cantabil Retail, and Nitin Spinners, and Below Average for Baazar Style, Sangam India, Himatsing. Seide, and Rupa & Co.<BR><BR>Return Snapshot: City Pulse Multi has the highest 1-year return at 614.54%, while Dollar Industrie has the lowest at -24.39%. Baazar Style's 1-year return is not available for comparison. Additionally, peers with negative six-month returns include Dollar Industrie, SP Apparels, Himatsing. Seide, and Rupa & Co.

Read More

How big is Baazar Style?

24-Jul-2025

As of 24th July, Baazar Style Retail Ltd has a market capitalization of 2,045.00 Cr, classifying it as a Small Cap company, with recent net sales of 1,343.71 Cr and a net profit of 14.67 Cr over the last four quarters.

As of 24th July, <BR><BR>Market Cap: Baazar Style Retail Ltd has a market capitalization of 2,045.00 Cr, classifying it as a Small Cap company.<BR><BR>Recent Quarterly Performance: The sum of Net Sales for the latest 4 quarters is 1,343.71 Cr, while the sum of Net Profit for the same period is 14.67 Cr.<BR><BR>Balance Sheet Snapshot: The reporting period for the balance sheet is March 2024. Shareholder's Funds are valued at 215.13 Cr, and Total Assets amount to 1,150.08 Cr.

Read More

When is the next results date for Baazar Style?

04-Nov-2025

The next results date for Baazar Style is 10 November 2025.

The next results date for Baazar Style is scheduled for 10 November 2025.

Read More

Are Baazar Style latest results good or bad?

11-Nov-2025

Baazar Style's latest Q2 FY26 results are strong, with a net profit of ₹51.49 crore and a 40.71% revenue increase, indicating significant growth. However, investors should be cautious about the sustainability of this performance due to past volatility and reliance on seasonal demand.

Baazar Style's latest results for Q2 FY26 indicate a significant turnaround in performance, showcasing strong growth and profitability. The company reported a net profit of ₹51.49 crore, which represents an astonishing increase of 2,399.51% quarter-on-quarter. Additionally, revenue reached ₹531.69 crore, reflecting a 40.71% increase from the previous quarter and a robust 70.99% growth year-on-year.<BR><BR>The operating margin improved to 13.0%, up from 7.84% in the same quarter last year, and the PAT margin expanded to 9.68%, a notable recovery from a negative margin in the previous year. This performance highlights Baazar Style's ability to capitalize on the festive shopping season, which typically boosts sales.<BR><BR>However, while these results are impressive, they come with some cautionary notes. The company has a history of profitability volatility, with previous quarters showing losses or minimal profits. The sustainability of this recent profitability is uncertain, as it heavily relies on seasonal demand. Furthermore, Baazar Style faces challenges such as weak capital efficiency, high leverage, and concerns about maintaining consistent profitability throughout the year.<BR><BR>In summary, the latest results are good in terms of growth and profitability, but investors should remain cautious about the long-term sustainability of this performance.

Read More

How has been the historical performance of Baazar Style?

17-Nov-2025

Baazar Style has shown significant growth in net sales, increasing from 787.90 Cr in Mar'23 to 1,343.71 Cr in Mar'25, while total assets rose from 854.39 Cr to 1,732.87 Cr. However, profitability metrics like profit before tax and cash flow from operations have fluctuated, indicating some challenges despite overall growth.

Answer:<BR>The historical performance of Baazar Style shows significant growth in net sales and profitability over the past three years.<BR><BR>Breakdown:<BR>Baazar Style's net sales have increased from 787.90 Cr in Mar'23 to 972.88 Cr in Mar'24, and further to 1,343.71 Cr in Mar'25, indicating a strong upward trend. Total operating income mirrors this growth, reaching 1,343.71 Cr in Mar'25. The company's total expenditure also rose, from 686.42 Cr in Mar'23 to 1,154.13 Cr in Mar'25, largely driven by increased purchases of finished goods and employee costs. Operating profit (PBDIT) has improved from 107.97 Cr in Mar'23 to 198.56 Cr in Mar'25, although the operating profit margin slightly declined from 14.61% in Mar'24 to 14.11% in Mar'25. Profit before tax peaked at 29.22 Cr in Mar'24 but fell to 18.88 Cr in Mar'25, while profit after tax also decreased from 21.94 Cr in Mar'24 to 14.66 Cr in Mar'25. The company's total assets grew significantly from 854.39 Cr in Mar'23 to 1,732.87 Cr in Mar'25, with total liabilities also increasing from 309.80 Cr to 551.44 Cr over the same period. Cash flow from operating activities decreased from 111.00 Cr in Mar'24 to 52.00 Cr in Mar'25, while net cash inflow remained positive at 4.00 Cr in Mar'25, up from 8.00 Cr in Mar'24. Overall, Baazar Style has demonstrated robust growth in sales and assets, despite some fluctuations in profitability and cash flow.

Read More

Should I buy, sell or hold Baazar Style?

19-Nov-2025

Why is Baazar Style falling/rising?

05-Dec-2025

As of 04-Dec, Baazar Style Retail Ltd's stock price is at 282.65, down 1.34%. The stock has significantly underperformed the Sensex, with a year-to-date decline of 8.98% compared to the Sensex's increase of 9.12%, indicating a lack of investor confidence despite strong long-term growth indicators.

As of 04-Dec, Baazar Style Retail Ltd's stock price is currently at 282.65, reflecting a decrease of 3.85 or 1.34%. The stock has been underperforming significantly compared to the benchmark Sensex, with a one-week decline of 5.12% against a mere 0.53% drop in the Sensex. Over the past month, the stock has fallen by 15.16%, while the Sensex has gained 2.16%. Year-to-date, Baazar Style's stock is down 8.98%, contrasting sharply with the Sensex's increase of 9.12%.<BR><BR>Today's trading performance indicates that the stock initially opened with a gain of 2.01% but has since declined, underperforming its sector by 1.49%. The stock reached an intraday high of Rs 292.25 but has been trading below its moving averages across various time frames, indicating a bearish trend. Additionally, there has been a notable drop in investor participation, with delivery volume falling by 54.83% compared to the five-day average, suggesting reduced interest among investors.<BR><BR>Despite the company's strong long-term growth indicators, such as a 30.60% annual increase in net sales and a remarkable 2399.51% growth in net profit, the stock's recent performance reflects a lack of investor confidence and market momentum. This combination of factors contributes to the current decline in Baazar Style's stock price.

Read More

Is Baazar Style technically bullish or bearish?

05-Dec-2025

As of December 4, 2025, Baazar Style's technical trend has shifted to mildly bearish, influenced by bearish weekly MACD and Bollinger Bands, despite mildly bullish daily moving averages, and it has underperformed against the Sensex across multiple time frames.

As of 4 December 2025, the technical trend for Baazar Style has changed from sideways to mildly bearish. The current stance is mildly bearish, driven primarily by the weekly MACD and Bollinger Bands indicating bearish conditions. The KST is also mildly bearish, and the OBV shows a similar trend. While the daily moving averages are mildly bullish, they are not strong enough to counteract the overall bearish signals from the weekly indicators. The stock has underperformed significantly compared to the Sensex over multiple time frames, further supporting the bearish outlook.

Read More
iScoreScore
Click here to find our call on this stock
Strong Sell
Sell
Hold
Buy
Strong Buy

MarketsMojo — Loved in India, Now Global

The power of Mojo is now in 29 countries. Explore global equities with the same cutting-edge features you love.

Dashboard
1

Poor Management Efficiency with a low ROCE of 9.17%

  • The company has been able to generate a Return on Capital Employed (avg) of 9.17% signifying low profitability per unit of total capital (equity and debt)
2

Low ability to service debt as the company has a high Debt to EBITDA ratio of 3.31 times

3

Healthy long term growth as Net Sales has grown by an annual rate of 30.60% and Operating profit at 49.28%

 
4

With a growth in Net Profit of 2399.51%, the company declared Very Positive results in Sep 25

5

With ROCE of 9.2, it has a Very Attractive valuation with a 2.3 Enterprise value to Capital Employed

stock-summaryMojo Parameters
Mojo Parameters
Loading Valuation Snapshot...
Stock DNA
stock-summary
Industry

Garments & Apparels

stock-summary
Market cap

INR 2,065 Cr (Small Cap)

stock-summary
P/E

57.00

stock-summary
Industry P/E

83

stock-summary
Dividend Yield

0.00%

stock-summary
Debt Equity

1.81

stock-summary
Return on Equity

8.07%

stock-summary
Price to Book

4.62

Revenue and Profits:
Net Sales:
532 Cr
(Quarterly Results - Sep 2025)
Net Profit:
51 Cr
stock-summaryTotal Returns
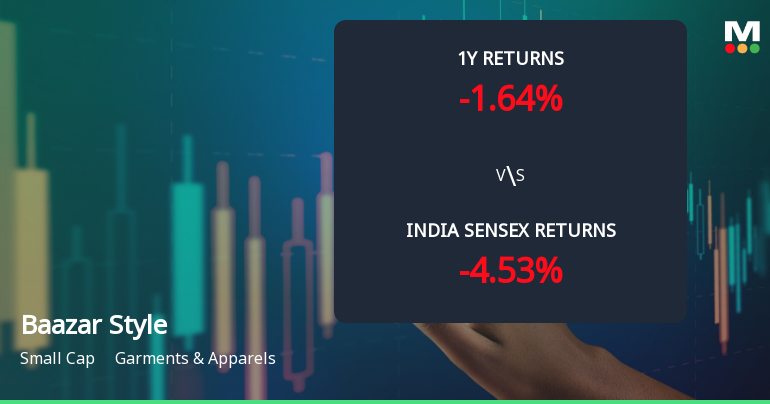
Total Returns (Price + Dividend) stock-summary
Dividend Yield (0%)
TimePeriod
Price Return
Dividend Return
Total Return
3 Months
-20.26%
0%
-20.26%
6 Months
7.96%
0%
7.96%
1 Year
-13.83%
0%
-13.83%
2 Years
0%
0%
0.0%
3 Years
0%
0%
0.0%
4 Years
0%
0%
0.0%
5 Years
0%
0%
0.0%

Baazar Style for the last several years.

Risk Adjusted Returns v/s stock-summary
Returns Beta
Icon
Beta has not been calculated since enough price history is not available
stock-summaryNews & Corporate Actions
News
Announcements stock-summary

Disclosure Under Regulation 30 Of The Securities And Exchange Board Of India (Listing Obligations And Disclosure Requirements) Regulations 2015

20-Nov-2025 | Source : BSE

Pursuant to Regulation 30 of the Securities and Exchange Board of India (Listing Obligations and Disclosure Requirements) Regulations 2015 we inform you that the Company has filed a plaint and received Order of Injunction in favour of the Company was passed details of which are enclosed herewith.

Announcement under Regulation 30 (LODR)-Earnings Call Transcript

15-Nov-2025 | Source : BSE

This is further to our letter dated November 11 2025 whereby the Company had submitted the link to the audio recording of conference call with Investor/Analysts held post announcement of Unaudited Financial results for the Quarter and half year ended September 30 2025 please find enclosed herewith the transcript of the said transcript of the said conference call for your information and record.

Announcement under Regulation 30 (LODR)-Analyst / Investor Meet - Outcome

11-Nov-2025 | Source : BSE

Pursuant to Regulation 30 of the Securities and Exchange Board of India (Listing Obligations and Disclosure Requirements) Regulations 2015 this is to inform you that the audio recording of conference call held with Investors/Analysts on November 11 2025 on Unaudited Financial Results for the quarter ended September 30 2025 can be accessed from the following link: https://stylebaazar.in/Theme/Uploads/Investor/StockExchangeFiling/2bace057-e6ce-4475-a927-d2adab022aa2.mp3

Corporate Actions stock-summary
stock-summary
BOARD MEETING

No Upcoming Board Meetings

stock-summary
DIVIDEND

No Dividend history available

stock-summary
SPLITS

No Splits history available

stock-summary
BONUS

No Bonus history available

stock-summary
RIGHTS

No Rights history available

stock-summaryKey Factors
Quality key factors stock-summary
Factor
Value
Sales Growth (5y)
30.60%
EBIT Growth (5y)
49.28%
EBIT to Interest (avg)
1.50
Debt to EBITDA (avg)
4.93
Net Debt to Equity (avg)
1.81
Sales to Capital Employed (avg)
1.03
Tax Ratio
24.79%
Dividend Payout Ratio
0
Pledged Shares
0
Institutional Holding
13.48%
ROCE (avg)
6.78%
ROE (avg)
8.07%
Valuation key factors
Factor
Value
P/E Ratio
57
Industry P/E
83
Price to Book Value
4.62
EV to EBIT
24.92
EV to EBITDA
11.72
EV to Capital Employed
2.29
EV to Sales
1.76
PEG Ratio
NA
Dividend Yield
NA
ROCE (Latest)
9.17%
ROE (Latest)
8.07%
Technicals key factors
Indicator
Weekly
Monthly
MACD
Bearish
RSI
No Signal
No Signal
Bollinger Bands
Bearish
Moving Averages
Mildly Bullish (Daily)
KST
Mildly Bearish
Dow Theory
No Trend
No Trend
OBV
Mildly Bearish
Mildly Bearish
stock-summary Technical Indicator Scale: Bearish, Mildly Bearish, Sideways, Mildly Bullish, Bullish  Turned 
stock-summaryShareholding
Shareholding Snapshot : Sep 2025stock-summary
Shareholding Compare (%holding) stock-summary
Majority shareholders

Promoters

Pledged Promoter Holdings

None

Mutual Funds

Held by 5 Schemes (7.02%)

FIIs

Held by 22 FIIs (3.13%)

Promoter with highest holding

Rohit Kedia (5.98%)

Highest Public shareholder

Dinesh Agarwal (huf) (4.12%)

Individual Investors Holdings

25.35%

stock-summaryFinancial
[
  {
    "link": "quarterly",
    "btn_text": "All Quarterly Results",
    "header": "Quarterly Results Snapshot (Consolidated) - Sep'25 - QoQ",
    "rhs": [
      {
        "prefix": "Net Sales ",
        "suffix": "QoQ Growth in quarter ended Sep 2025 is 40.71% vs 9.41% in Jun 2025",
        "dir": 1
      },
      {
        "prefix": "Consolidated Net Profit ",
        "suffix": "QoQ Growth in quarter ended Sep 2025 is 2,399.51% vs 132.24% in Jun 2025",
        "dir": 1
      }
    ],
    "table": {
      "header": [
        "Sep'25",
        "Jun'25",
        "Change(%)"
      ],
      "body": [
        {
          "field": "Net Sales",
          "val1": "531.69",
          "val2": "377.86",
          "chgp": "40.71%",
          "chgp_class": "positive"
        },
        {
          "field": "Operating Profit (PBDIT) excl Other Income",
          "val1": "69.14",
          "val2": "58.23",
          "chgp": "18.74%",
          "chgp_class": "positive"
        },
        {
          "field": "Interest",
          "val1": "17.03",
          "val2": "23.51",
          "chgp": "-27.56%",
          "chgp_class": "positive"
        },
        {
          "field": "Exceptional Items",
          "val1": "55.26",
          "val2": "-0.77",
          "chgp": "7,276.62%",
          "chgp_class": "positive"
        },
        {
          "field": "Consolidate Net Profit",
          "val1": "51.49",
          "val2": "2.06",
          "chgp": "2,399.51%",
          "chgp_class": "positive"
        },
        {
          "field": "Operating Profit Margin (Excl OI)",
          "val1": "13.00%",
          "val2": "15.41%",
          "chgp": "-2.41%",
          "chgp_class": "negative"
        }
      ]
    }
  },
  {
    "link": "half-yearly",
    "btn_text": "All Half Yearly Results",
    "header": "Half Yearly Results Snapshot (Consolidated) - Sep'25",
    "rhs": [
      {
        "prefix": "Net Sales ",
        "suffix": " Growth in half year ended Sep 2025 is 55.02% vs 41.00% in Sep 2024",
        "dir": 1
      },
      {
        "prefix": "Consolidated Net Profit ",
        "suffix": " Growth in half year ended Sep 2025 is 672.12% vs 5.93% in Sep 2024",
        "dir": 1
      }
    ],
    "table": {
      "header": [
        "Sep'25",
        "Sep'24",
        "Change(%)"
      ],
      "body": [
        {
          "field": "Net Sales",
          "val1": "909.55",
          "val2": "586.74",
          "chgp": "55.02%",
          "chgp_class": "positive"
        },
        {
          "field": "Operating Profit (PBDIT) excl Other Income",
          "val1": "127.37",
          "val2": "66.35",
          "chgp": "91.97%",
          "chgp_class": "positive"
        },
        {
          "field": "Interest",
          "val1": "40.53",
          "val2": "30.00",
          "chgp": "35.10%",
          "chgp_class": "negative"
        },
        {
          "field": "Exceptional Items",
          "val1": "54.49",
          "val2": "-10.76",
          "chgp": "606.41%",
          "chgp_class": "positive"
        },
        {
          "field": "Consolidate Net Profit",
          "val1": "53.55",
          "val2": "-9.36",
          "chgp": "672.12%",
          "chgp_class": "positive"
        },
        {
          "field": "Operating Profit Margin (Excl OI)",
          "val1": "14.00%",
          "val2": "11.31%",
          "chgp": "2.69%",
          "chgp_class": "positive"
        }
      ]
    }
  },
  {
    "link": "nine-monthly",
    "btn_text": "All Nine Monthly Results",
    "header": "Nine Monthly Results Snapshot (Standalone) - Dec'24",
    "rhs": [
      {
        "prefix": "Net Sales ",
        "suffix": "Not Applicable: The company has declared_date for only one period",
        "dir": 0
      },
      {
        "prefix": "Standalone Net Profit ",
        "suffix": "Not Applicable: The company has declared_date for only one period",
        "dir": 0
      }
    ],
    "table": {
      "header": [
        "Dec'24",
        "Dec'23",
        "Change(%)"
      ],
      "body": [
        {
          "field": "Net Sales",
          "val1": "998.22",
          "val2": "749.23",
          "chgp": "33.23%",
          "chgp_class": "positive"
        },
        {
          "field": "Operating Profit (PBDIT) excl Other Income",
          "val1": "149.76",
          "val2": "118.60",
          "chgp": "26.27%",
          "chgp_class": "positive"
        },
        {
          "field": "Interest",
          "val1": "47.34",
          "val2": "35.50",
          "chgp": "33.35%",
          "chgp_class": "negative"
        },
        {
          "field": "Exceptional Items",
          "val1": "-10.76",
          "val2": "0.00",
          "chgp": "",
          "chgp_class": "neutral"
        },
        {
          "field": "Standalone Net Profit",
          "val1": "21.14",
          "val2": "28.40",
          "chgp": "-25.56%",
          "chgp_class": "negative"
        },
        {
          "field": "Operating Profit Margin (Excl OI)",
          "val1": "15.00%",
          "val2": "15.83%",
          "chgp": "-0.83%",
          "chgp_class": "negative"
        }
      ]
    }
  },
  {
    "link": "annual",
    "btn_text": "All Annual Results",
    "header": "Annual Results Snapshot (Consolidated) - Mar'25",
    "rhs": [
      {
        "prefix": "Net Sales ",
        "suffix": "YoY Growth in year ended Mar 2025 is 38.12% vs 23.48% in Mar 2024",
        "dir": 1
      },
      {
        "prefix": "Consolidated Net Profit ",
        "suffix": "YoY Growth in year ended Mar 2025 is -33.18% vs 330.20% in Mar 2024",
        "dir": -1
      }
    ],
    "table": {
      "header": [
        "Mar'25",
        "Mar'24",
        "Change(%)"
      ],
      "body": [
        {
          "field": "Net Sales",
          "val1": "1,343.71",
          "val2": "972.88",
          "chgp": "38.12%",
          "chgp_class": "positive"
        },
        {
          "field": "Operating Profit (PBDIT) excl Other Income",
          "val1": "189.58",
          "val2": "142.16",
          "chgp": "33.36%",
          "chgp_class": "positive"
        },
        {
          "field": "Interest",
          "val1": "69.03",
          "val2": "49.43",
          "chgp": "39.65%",
          "chgp_class": "negative"
        },
        {
          "field": "Exceptional Items",
          "val1": "-10.76",
          "val2": "0.00",
          "chgp": "",
          "chgp_class": "neutral"
        },
        {
          "field": "Consolidate Net Profit",
          "val1": "14.66",
          "val2": "21.94",
          "chgp": "-33.18%",
          "chgp_class": "negative"
        },
        {
          "field": "Operating Profit Margin (Excl OI)",
          "val1": "14.11%",
          "val2": "14.61%",
          "chgp": "-0.50%",
          "chgp_class": "negative"
        }
      ]
    }
  }
]
Quarterly Results Snapshot (Consolidated) - Sep'25 - QoQstock-summary
Sep'25
Jun'25
Change(%)
Net Sales
531.69
377.86
40.71%
Operating Profit (PBDIT) excl Other Income
69.14
58.23
18.74%
Interest
17.03
23.51
-27.56%
Exceptional Items
55.26
-0.77
7,276.62%
Consolidate Net Profit
51.49
2.06
2,399.51%
Operating Profit Margin (Excl OI)
13.00%
15.41%
-2.41%
Values in Rs Cr.
Direction Arrows
Net Sales

QoQ Growth in quarter ended Sep 2025 is 40.71% vs 9.41% in Jun 2025

Direction Arrows
Consolidated Net Profit

QoQ Growth in quarter ended Sep 2025 is 2,399.51% vs 132.24% in Jun 2025

Half Yearly Results Snapshot (Consolidated) - Sep'25stock-summary
Sep'25
Sep'24
Change(%)
Net Sales
909.55
586.74
55.02%
Operating Profit (PBDIT) excl Other Income
127.37
66.35
91.97%
Interest
40.53
30.00
35.10%
Exceptional Items
54.49
-10.76
606.41%
Consolidate Net Profit
53.55
-9.36
672.12%
Operating Profit Margin (Excl OI)
14.00%
11.31%
2.69%
Values in Rs Cr.
Direction Arrows
Net Sales

Growth in half year ended Sep 2025 is 55.02% vs 41.00% in Sep 2024

Direction Arrows
Consolidated Net Profit

Growth in half year ended Sep 2025 is 672.12% vs 5.93% in Sep 2024

Nine Monthly Results Snapshot (Standalone) - Dec'24stock-summary
Dec'24
Dec'23
Change(%)
Net Sales
998.22
749.23
33.23%
Operating Profit (PBDIT) excl Other Income
149.76
118.60
26.27%
Interest
47.34
35.50
33.35%
Exceptional Items
-10.76
0.00
Standalone Net Profit
21.14
28.40
-25.56%
Operating Profit Margin (Excl OI)
15.00%
15.83%
-0.83%
Values in Rs Cr.
Net Sales

Not Applicable: The company has declared_date for only one period

Standalone Net Profit

Not Applicable: The company has declared_date for only one period

Annual Results Snapshot (Consolidated) - Mar'25stock-summary
Mar'25
Mar'24
Change(%)
Net Sales
1,343.71
972.88
38.12%
Operating Profit (PBDIT) excl Other Income
189.58
142.16
33.36%
Interest
69.03
49.43
39.65%
Exceptional Items
-10.76
0.00
Consolidate Net Profit
14.66
21.94
-33.18%
Operating Profit Margin (Excl OI)
14.11%
14.61%
-0.50%
Values in Rs Cr.
Direction Arrows
Net Sales

YoY Growth in year ended Mar 2025 is 38.12% vs 23.48% in Mar 2024

Direction Arrows
Consolidated Net Profit

YoY Growth in year ended Mar 2025 is -33.18% vs 330.20% in Mar 2024

stock-summaryCompany CV
About Baazar Style Retail Ltd stock-summary
stock-summary
Baazar Style Retail Ltd
Small Cap
Garments & Apparels
Baazar Style Retail Limited was incorporated as Dwarkadas Mohanlal Private Limited, a Private Limited Company on June 3, 2013, by the Registrar of Companies, at West Bengal. Subsequently, the name of the Company was changed to Baazar Style Retail Private Limited and a fresh Certificate of Incorporation dated November 26, 2013 was issued by the RoC.
Company Coordinates stock-summary
Icon
No Company Details Available