
Compare Baazar Style with Similar Stocks
Stock DNA
Garments & Apparels
INR 2,253 Cr (Small Cap)
82.00
70
0.00%
2.18
6.17%
5.07
Total Returns (Price + Dividend) 
Baazar Style for the last several years.
Risk Adjusted Returns v/s
Returns Beta

News
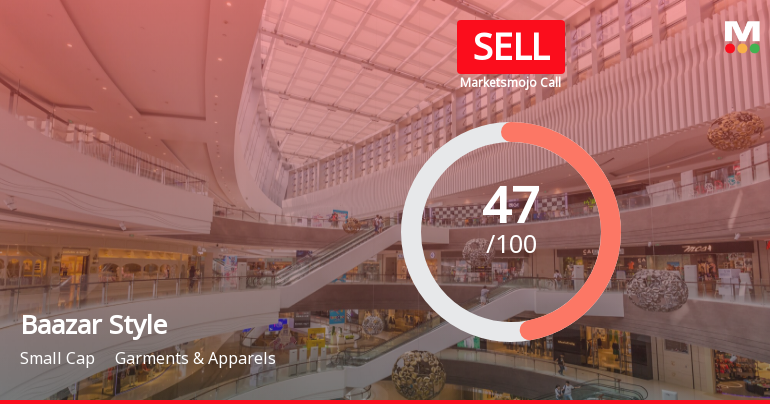
Baazar Style Retail Ltd is Rated Sell
Baazar Style Retail Ltd is rated Sell by MarketsMOJO. This rating was last updated on 29 May 2026, reflecting a change from the previous Hold rating. However, the analysis and financial metrics discussed below represent the stock’s current position as of 15 July 2026, providing investors with the latest insights into the company’s performance and outlook.
Read full news article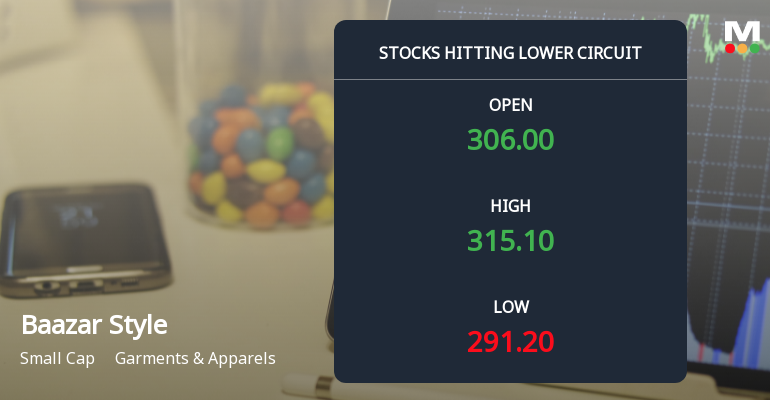
Baazar Style Retail Ltd Locks at Lower Circuit With 4.99% Loss — Sellers Queue, No Buyers in Sight
At Rs 290.3, sellers were still queuing — but there were no buyers willing to take the other side. Baazar Style Retail Ltd locked at its lower circuit of 4.99% on 10 Jul 2026, with unfilled sell orders and a frozen price, reflecting persistent selling pressure despite the price band limit.
Read full news article
Baazar Style Retail Ltd Shows Mixed Technical Signals Amid Mildly Bullish Momentum
Baazar Style Retail Ltd, a small-cap player in the Garments & Apparels sector, has recently exhibited a shift in price momentum, moving from a sideways trend to a mildly bullish stance. Despite a mixed bag of technical indicator signals, the stock’s recent performance and underlying metrics suggest cautious optimism for investors navigating this evolving landscape.
Read full news article Announcements
Intimation Of Opening Of New Retail Store Of The Company
11-Jul-2026 | Source : BSEPursuant to Regulation 30 of the Securities and Exchange Board of India (Listing Obligations and Disclosure Requirements)Regulations 2015 this is to inform you that the Company has opened a new store of Style Baazar at Kalambagh Muzaffarpur Bihar today.
Compliances-Certificate under Reg. 74 (5) of SEBI (DP) Regulations 2018
08-Jul-2026 | Source : BSEPursuant to Regulation 74(5) of the Securities and Exchange Board of India (Depositories and Participants) Regulations 2018 we are enclosing herewith the Certificate issued by M/s MUFG Intime India Private Limited (formerly known as Link Intime India Private Limited) the Registrar and Share Transfer agent of the Company for the Quarter ended June 30 2026
Intimation Of Opening Of New Retail Store Of The Company
04-Jul-2026 | Source : BSEPursuant to Regulation 30 of the Securities and Exchange Board of India (Listing Obligations and Disclosure Requirements) regulations 2015 this is to inform that the Company has opened a new store of Style Baazar at Gilat Bazar Varanasi Uttar Pradesh today.
Corporate Actions

No Upcoming Board Meetings

No Dividend history available

No Splits history available

No Bonus history available

No Rights history available
Quality key factors
Valuation key factors
Technicals key factors
 Technical Indicator Scale: Bearish, Mildly Bearish, Sideways, Mildly Bullish, Bullish Turned
 Shareholding Snapshot : May 2026
Shareholding Compare (%holding)
Non Institution
None
Held by 2 Schemes (4.36%)
Held by 13 FIIs (1.3%)
Rohit Kedia (5.86%)
Dinesh Agarwal (huf) (4.04%)
25.85%
Quarterly Results Snapshot (Consolidated) - Mar'26 - QoQ

QoQ Growth in quarter ended Mar 2026 is -0.17% vs -12.26% in Dec 2025

QoQ Growth in quarter ended Mar 2026 is -235.28% vs -63.18% in Dec 2025
Half Yearly Results Snapshot (Consolidated) - Sep'25
Growth in half year ended Sep 2025 is 55.02% vs 41.00% in Sep 2024
Growth in half year ended Sep 2025 is 672.12% vs 5.93% in Sep 2024
Nine Monthly Results Snapshot (Consolidated) - Dec'25
YoY Growth in nine months ended Dec 2025 is 37.83% vs 33.22% in Dec 2024
YoY Growth in nine months ended Dec 2025 is 244.30% vs -25.77% in Dec 2024
Annual Results Snapshot (Consolidated) - Mar'26
YoY Growth in year ended Mar 2026 is 37.01% vs 38.12% in Mar 2025
YoY Growth in year ended Mar 2026 is 219.71% vs -33.18% in Mar 2025
About Baazar Style Retail Ltd

Company Coordinates


