
Compare Manba Finance with Similar Stocks
Stock DNA
Non Banking Financial Company (NBFC)
INR 665 Cr (Micro Cap)
15.00
21
0.68%
3.80
11.07%
1.63
Total Returns (Price + Dividend) 
Latest dividend: 0.20290766208251473 per share ex-dividend date: Feb-06-2026
Risk Adjusted Returns v/s
Returns Beta

News

Manba Finance Ltd is Rated Sell
Manba Finance Ltd is rated 'Sell' by MarketsMOJO, with this rating last updated on 19 May 2026. However, the analysis and financial metrics discussed here reflect the stock's current position as of 22 June 2026, providing investors with the latest insights into the company’s performance and outlook.
Read full news article
Manba Finance Ltd Technical Momentum Shifts Amid Mixed Market Signals
Manba Finance Ltd, a micro-cap player in the Non Banking Financial Company (NBFC) sector, has exhibited a notable shift in its technical momentum, moving from a mildly bearish stance to a sideways trend. This transition is underscored by a complex interplay of technical indicators, including MACD, RSI, Bollinger Bands, and moving averages, which collectively paint a nuanced picture of the stock’s near-term prospects amid a volatile market backdrop.
Read full news article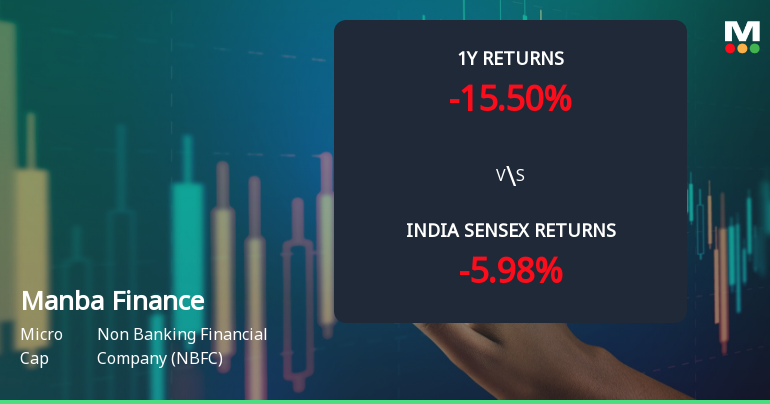
Manba Finance Ltd Technical Momentum Shifts Amid Mixed Market Signals
Manba Finance Ltd, a micro-cap player in the Non Banking Financial Company (NBFC) sector, has experienced a notable shift in its technical momentum, moving from a sideways trend to a mildly bearish stance. Despite some bullish weekly indicators, the overall technical picture remains mixed, reflecting cautious investor sentiment amid recent price volatility and sector headwinds.
Read full news article Announcements
General Update On A One To One Meet Of Senior Management Of Company Held With An Analysts/Investors On 16-06-2026.
17-Jun-2026 | Source : BSEGeneral update on one to one meet of management of company held with Analysts/ Investors on 16-06-2026
Announcement under Regulation 30 (LODR)-Press Release / Media Release
16-Jun-2026 | Source : BSEPress Release - under regulation 30 of SEBI LODR
General Update
16-Jun-2026 | Source : BSEGeneral Update on a one to one meet of senior management of company held with an Analysts/Investors on 16-06-2026.
Corporate Actions

No Upcoming Board Meetings

Manba Finance Ltd has declared 2% dividend, ex-date: 06 Feb 26

No Splits history available

No Bonus history available

No Rights history available
Quality key factors
Valuation key factors
Technicals key factors
 Technical Indicator Scale: Bearish, Mildly Bearish, Sideways, Mildly Bullish, Bullish Turned
 Shareholding Snapshot : Mar 2026
Shareholding Compare (%holding)
Promoters
None
Held by 0 Schemes
Held by 4 FIIs (0.87%)
Manba Investments & Securities Pvt Ltd (27.68%)
Chartered Finance & Leasing Limited (1.68%)
18.21%
Quarterly Results Snapshot (Standalone) - Mar'26 - QoQ

QoQ Growth in quarter ended Mar 2026 is 7.21% vs 19.12% in Dec 2025
QoQ Growth in quarter ended Mar 2026 is -14.91% vs 14.74% in Dec 2025
Half Yearly Results Snapshot (Standalone) - Sep'25
Growth in half year ended Sep 2025 is 27.74% vs 43.16% in Sep 2024

Growth in half year ended Sep 2025 is 25.74% vs 1.57% in Sep 2024
Nine Monthly Results Snapshot (Standalone) - Dec'25
YoY Growth in nine months ended Dec 2025 is 30.04% vs 2.38% in Dec 2024
YoY Growth in nine months ended Dec 2025 is 14.94% vs 7.55% in Dec 2024
Annual Results Snapshot (Standalone) - Mar'26
YoY Growth in year ended Mar 2026 is 31.82% vs 41.24% in Mar 2025
YoY Growth in year ended Mar 2026 is 20.00% vs 21.23% in Mar 2025
About Manba Finance Ltd

Company Coordinates


