Hyundai Motor I

  • Market Cap: Large Cap
  • Industry: Automobiles
  • ISIN: INE0V6F01027
  • NSEID: HYUNDAI
  • BSEID: 544274
INR
2,206.65
10.15 (0.46%)
BSENSE

Feb 03

BSE+NSE Vol: 11.11 lacs

  • Price Points
  • Score
  • Mojo Parameters
  • Total Return
  • News and Corporate Actions
  • Key factors
  • Shareholding
  • Financials
  • CompanyCV
stock-summaryPrice Point
High/Low

1Day

52 Week

Valuation
Technical
Day's Volume

CASH

11.11 lacs (49.88%) Volume

Shareholding (Dec 2025)

FII

6.43%

Held by 574 FIIs

DII

0.11%

Held by 37 DIIs

Promoter

82.50%

Who are the top shareholders of the Hyundai Motor I?

06-Jun-2025

The top shareholders of Hyundai Motor I include Hyundai Motor Company with 82.5%, followed by foreign institutional investors at 7.17%, mutual funds at 5.14%, and individual investors holding about 3.0%. The largest public shareholder is HDFC Trustee Company Limited, with a 2.35% stake through the HDFC Flexi Cap Fund.

The top shareholders of Hyundai Motor I include Hyundai Motor Company, which holds a significant 82.5% of the shares, making it the largest promoter. Other notable shareholders include various mutual funds, which collectively hold 5.14% through 24 schemes, and foreign institutional investors (FIIs), who own 7.17% through 424 different entities. The highest public shareholder is HDFC Trustee Company Limited, specifically through the HDFC Flexi Cap Fund, with a holding of 2.35%. Additionally, individual investors hold about 3.0% of the shares.

View full answer

Has Hyundai Motor I declared dividend?

06-Jun-2025

No Dividend History Available

Who are the peers of the Hyundai Motor I?

04-Jun-2025

Hyundai Motor I's peers include Maruti Suzuki, M & M, Tata Motors, Bajaj Auto, Eicher Motors, TVS Motor Co., Hero MotoCorp, Ashok Leyland, and Escorts Kubota. Key insights show excellent management and growth for Hyundai, with M & M leading in 1-year returns at 15.79%, while Tata Motors has the lowest at -25.59%.

Peers: The peers of Hyundai Motor I are Maruti Suzuki, M & M, Tata Motors, Bajaj Auto, Eicher Motors, TVS Motor Co., Hero MotoCorp, Ashok Leyland, and Escorts Kubota.<BR><BR>Quality Snapshot: Excellent management risk is observed at Bajaj Auto, Hyundai Motor I, and Eicher Motors, while Good management risk is found at Maruti Suzuki, M & M, Tata Motors, TVS Motor Co., Hero MotoCorp, Ashok Leyland, and Escorts Kubota, and the rest. Excellent growth is noted at Bajaj Auto, Hyundai Motor I, and M & M, while Excellent capital structure is seen at Maruti Suzuki, Bajaj Auto, Hyundai Motor I, Eicher Motors, and Escorts Kubota, with the rest showing Average or Below Average capital structures.<BR><BR>Return Snapshot: The peer with the highest 1-year return is M & M at 15.79%, while Tata Motors has the lowest at -25.59%, and Hyundai Motor I's 1-year return is not available for comparison. Additionally, Tata Motors, Bajaj Auto, Escorts Kubota, and Ola Electric have negative six-month returns.

View full answer

What does Hyundai Motor I do?

17-Jul-2025

Hyundai Motor India Ltd is a large-cap automobile company incorporated in 1996, with recent net sales of ₹179,403 Cr and a net profit of ₹16,144 Cr as of March 2025. Key metrics include a P/E ratio of 32.00 and a return on equity of 34.83%.

Overview:<BR>Hyundai Motor India Ltd operates in the automobiles industry and is categorized as a large-cap company.<BR><BR>History:<BR>The company was incorporated on May 6, 1996, as a Public Limited Company. It received its Certificate of Commencement of Business on May 10, 1996. The latest quarterly results reported are for March 2025, showing net sales and profit figures.<BR><BR>Financial Snapshot:<BR>Most recent Net Sales: 179,403 Cr (Quarterly Results - Mar 2025) <BR>Most recent Net Profit: 16,144 Cr (Quarterly Results - Mar 2025) <BR>Market-cap value: INR 173,108 Cr (Large Cap)<BR><BR>Key Metrics:<BR>P/E: 32.00 <BR>Industry P/E: 22 <BR>Dividend Yield: 0.00% <BR>Debt-Equity: -0.46 <BR>Return on Equity: 34.83% <BR>Price-to-Book: 11.09 <BR><BR>Contact Details:<BR>Details: No Company Details Available <BR>Registrar Address: Not available.

View full answer

How big is Hyundai Motor I?

24-Jul-2025

As of 24th July, Hyundai Motor India Ltd has a market capitalization of 171,446.00 Cr, with recent net sales of 69,192.91 Cr and a net profit of 5,640.20 Cr.

As of 24th July, Hyundai Motor India Ltd has a market capitalization of 171,446.00 Cr, categorizing it as a Large Cap company.<BR><BR>For the latest four quarters, the company reported Net Sales of 69,192.91 Cr and a Net Profit of 5,640.20 Cr.<BR><BR>The latest annual reporting period for the balance sheet is March 2024, with Shareholder's Funds amounting to 10,665.66 Cr and Total Assets of 25,401.46 Cr.

View full answer

How has been the historical performance of Hyundai Motor I?

02-Dec-2025

Hyundai Motor I's historical performance over the past three years shows mixed results, with net sales increasing from 60,307.58 Cr in March 2023 to 69,192.89 Cr in March 2025, despite declines in profit metrics and cash flow. Total assets also grew significantly, indicating overall growth despite fluctuations in profitability.

Answer:<BR>The historical performance of Hyundai Motor I shows a mixed trend in key financial metrics over the past three years.<BR><BR>Breakdown:<BR>In terms of net sales, Hyundai Motor I reported 69,192.89 Cr in March 2025, a slight decrease from 69,829.06 Cr in March 2024, but a significant increase from 60,307.58 Cr in March 2023. Total operating income mirrored this trend, with figures of 69,192.89 Cr in March 2025, 69,829.06 Cr in March 2024, and 60,307.58 Cr in March 2023. The total expenditure, excluding depreciation, was 60,239.13 Cr in March 2025, down from 60,696.44 Cr in March 2024 and up from 52,758.80 Cr in March 2023. Operating profit (PBDIT) was 9,823.81 Cr in March 2025, down from 10,605.89 Cr in March 2024 but up from 8,677.84 Cr in March 2023. Profit before tax decreased to 7,591.35 Cr in March 2025 from 8,239.87 Cr in March 2024, while profit after tax was 5,640.21 Cr in March 2025, down from 6,060.04 Cr in March 2024. The earnings per share (EPS) also declined to 69.41 in March 2025 from 74.58 in March 2024. On the balance sheet, total assets increased to 29,065.26 Cr in March 2025 from 25,401.46 Cr in March 2024, while total liabilities rose to 29,065.26 Cr in March 2025 from 25,401.46 Cr in March 2024. The cash flow from operating activities decreased to 4,344.00 Cr in March 2025 from 9,251.00 Cr in March 2024, but the net cash inflow improved to 3,872.00 Cr in March 2025 from a net outflow of 16,767.00 Cr in March 2024. Overall, while there are fluctuations in profits and cash flow, the company has shown growth in sales and total assets over the past three years.

View full answer

Is Hyundai Motor I technically bullish or bearish?

03-Dec-2025

As of December 2, 2025, the market trend has shifted to sideways, with mixed signals from key indicators suggesting a neutral stance and indecision in the near term.

As of 2 December 2025, the technical trend has changed from mildly bullish to sideways. The current stance is neutral, with a lack of strong bullish or bearish signals. Key indicators include the weekly MACD and KST both showing mildly bearish conditions, while the daily moving averages are mildly bullish. The RSI shows no signal on both the weekly and monthly time frames, indicating indecision. Overall, the mixed signals suggest a sideways movement in the near term.

View full answer

Is Hyundai Motor I overvalued or undervalued?

04-Dec-2025

As of December 3, 2025, Hyundai Motor I is fairly valued with a PE ratio of 33.87 and an EV to EBITDA of 20.80, outperforming the Sensex with a year-to-date return of 32.08%, while compared to peers, Maruti Suzuki has a higher PE of 34.21 and EV to EBITDA of 25.49, and M & M is more attractively valued with a PE of 31.89 and EV to EBITDA of 16.28.

As of 3 December 2025, Hyundai Motor I has moved from an attractive to a fair valuation grade. The company is currently fairly valued based on its financial metrics. Key ratios include a PE ratio of 33.87, an EV to EBITDA of 20.80, and a ROE of 32.56%. <BR><BR>In comparison to its peers, Maruti Suzuki has a slightly higher PE ratio of 34.21 and an EV to EBITDA of 25.49, while M & M is more attractively valued with a PE of 31.89 and an EV to EBITDA of 16.28. Despite its fair valuation, Hyundai Motor I has outperformed the Sensex with a year-to-date return of 32.08% compared to the Sensex's 8.92%, indicating strong market performance relative to the broader index.

View full answer

When is the next results date for Hyundai Motor India Ltd?

28-Jan-2026

The next results date for Hyundai Motor India Ltd is February 2, 2026.

The next results date for Hyundai Motor India Ltd is scheduled for February 2, 2026.

View full answer

Are Hyundai Motor India Ltd latest results good or bad?

02-Feb-2026

Hyundai Motor India's latest results show record quarterly sales growth of 7.96% to ₹17,973.49 crores, driven by strong SUV demand. However, net profit declined by 21.49% and operating margins fell, indicating challenges in maintaining profitability despite strong sales.

Hyundai Motor India's latest results present a mixed picture. On one hand, the company achieved record quarterly sales of ₹17,973.49 crores, reflecting a solid year-on-year revenue growth of 7.96%. This indicates strong demand for its SUV portfolio, particularly models like the Creta and Venue.<BR><BR>However, the profitability metrics are concerning. The net profit for Q3 FY26 was ₹1,234.40 crores, which represents a significant decline of 21.49% compared to the previous quarter. Additionally, the operating margin fell sharply from 14.16% to 11.46%, indicating increased cost pressures and competitive challenges. The PAT margin also compressed to 7.01%, down from 9.16% in the previous quarter.<BR><BR>While the revenue growth is a positive sign, the decline in profitability raises questions about the sustainability of these gains in the face of rising input costs and competitive pressures. Overall, the results suggest that while Hyundai Motor India is performing well in terms of sales, it faces significant challenges in maintaining profitability.

View full answer

Why is Hyundai Motor India Ltd falling/rising?

03-Feb-2026

As of 02-Feb, Hyundai Motor India Ltd's stock price is currently at Rs 2,196.50, showing a slight increase today but a decline over the past week and month. Despite strong long-term fundamentals, recent underperformance against its sector and decreased investor participation may impact future price movements.

As of 02-Feb, Hyundai Motor India Ltd's stock price is rising, currently at Rs 2,196.50, reflecting an increase of 13.1 points or 0.6%. Despite this positive movement today, the stock has shown a decline of 3.00% over the past week and 3.20% over the past month, indicating some volatility in its recent performance. <BR><BR>Today's performance is particularly noteworthy as the stock underperformed its sector, which gained by 2.52%. Additionally, the stock touched an intraday low of Rs 2,125, representing a decrease of 2.67%. The moving averages indicate that while the stock is higher than its 5-day moving average, it is lower than the 20-day, 50-day, 100-day, and 200-day moving averages, suggesting a mixed trend in the short to medium term.<BR><BR>Investor participation has also decreased, with delivery volume falling by 15.79% compared to the 5-day average, which may indicate waning interest among investors. However, the stock has demonstrated strong long-term fundamentals, with a return on equity of 32.56% and healthy growth in net sales and operating profit. Despite a recent decline in profits, the stock has generated a significant return of 25.49% over the past year, outperforming the broader market.<BR><BR>In summary, while the stock is currently rising, it faces challenges such as recent underperformance relative to its sector and declining investor participation, which may affect its future price movements.

View full answer

Should I buy, sell or hold Hyundai Motor India Ltd?

03-Feb-2026
iScoreScore
Click here to find our call on this stock
Strong Sell
Sell
Hold
Buy
Strong Buy

MarketsMojo — Loved in India, Now Global

The power of Mojo is now in 29 countries. Explore global equities with the same cutting-edge features you love.

Dashboard

1

Strong Long Term Fundamental Strength with an average Return on Equity (ROE) of 32.56%

  • Healthy long term growth as Net Sales has grown by an annual rate of 12.90% and Operating profit at 26.79%
  • Company has a low Debt to Equity ratio (avg) at 0 times
2

With ROE of 32.6, it has a Fair valuation with a 10.2 Price to Book Value

3

Majority shareholders : Promoters

 
4

Market Beating Performance

stock-summaryMojo Parameters

Mojo Parameters

Loading Valuation Snapshot...

Stock DNA

stock-summary
Industry

Automobiles

stock-summary
Market cap

INR 179,011 Cr (Large Cap)

stock-summary
P/E

31.00

stock-summary
Industry P/E

25

stock-summary
Dividend Yield

0.96%

stock-summary
Debt Equity

-0.34

stock-summary
Return on Equity

32.56%

stock-summary
Price to Book

10.17

Revenue and Profits:
Net Sales:
17,973 Cr
(Quarterly Results - Dec 2025)
Net Profit:
1,234 Cr
stock-summaryTotal Returns
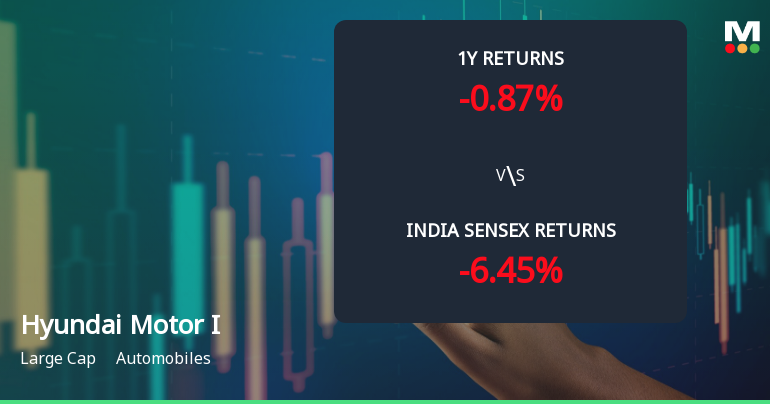
Total Returns (Price + Dividend) stock-summary
Dividend Yield (0.96%)
TimePeriod
Price Return
Dividend Return
Total Return
3 Months
-9.13%
0%
-9.13%
6 Months
1.14%
0%
1.14%
1 Year
22.51%
1.13%
23.64%
2 Years
0%
0%
0.0%
3 Years
0%
0%
0.0%
4 Years
0%
0%
0.0%
5 Years
0%
0%
0.0%

Latest dividend: 21 per share ex-dividend date: Aug-05-2025

Risk Adjusted Returns v/s stock-summary
Returns Beta
Icon
Beta has not been calculated since enough price history is not available
stock-summaryNews & Corporate Actions

News

Announcements stock-summary

Results

02-Feb-2026 | Source : BSE

Results

Board Meeting Outcome for Outcome Of The Board Meeting

02-Feb-2026 | Source : BSE

Outcome of Board Meeting

Announcement under Regulation 30 (LODR)-Press Release / Media Release

02-Feb-2026 | Source : BSE

Press Release on Un-audited Financial Results of the Company

Corporate Actions stock-summary

stock-summary
BOARD MEETING

No Upcoming Board Meetings

stock-summary
DIVIDEND

Hyundai Motor India Ltd has declared 210% dividend, ex-date: 05 Aug 25

stock-summary
SPLITS

No Splits history available

stock-summary
BONUS

No Bonus history available

stock-summary
RIGHTS

No Rights history available

stock-summaryKey Factors

Quality key factors stock-summary

Factor
Value
Sales Growth (5y)
12.90%
EBIT Growth (5y)
26.79%
EBIT to Interest (avg)
59.96
Debt to EBITDA (avg)
0.10
Net Debt to Equity (avg)
-0.34
Sales to Capital Employed (avg)
4.24
Tax Ratio
25.90%
Dividend Payout Ratio
181.09%
Pledged Shares
0
Institutional Holding
15.02%
ROCE (avg)
85.29%
ROE (avg)
32.56%

Valuation key factors

Factor
Value
P/E Ratio
31
Industry P/E
25
Price to Book Value
10.21
EV to EBIT
24.70
EV to EBITDA
18.92
EV to Capital Employed
14.91
EV to Sales
2.48
PEG Ratio
NA
Dividend Yield
0.95%
ROCE (Latest)
59.51%
ROE (Latest)
32.56%

Technicals key factors

Indicator
Weekly
Monthly
MACD
Mildly Bearish
RSI
No Signal
No Signal
Bollinger Bands
Bearish
Moving Averages
Mildly Bullish (Daily)
KST
Mildly Bearish
Dow Theory
Mildly Bearish
Bullish
OBV
Mildly Bearish
No Trend
stock-summary Technical Indicator Scale: Bearish, Mildly Bearish, Sideways, Mildly Bullish, Bullish  Turned 
stock-summaryShareholding
Shareholding Snapshot : Dec 2025stock-summary
Shareholding Compare (%holding) stock-summary
Majority shareholders

Promoters

Pledged Promoter Holdings

None

Mutual Funds

Held by 31 Schemes (5.8%)

FIIs

Held by 574 FIIs (6.43%)

Promoter with highest holding

Hyundai Motor Company (82.5%)

Highest Public shareholder

Hdfc Trustee Company Limited-hdfc Flexi Cap Fund (2.89%)

Individual Investors Holdings

2.21%

stock-summaryFinancial
[
  {
    "link": "quarterly",
    "btn_text": "All Quarterly Results",
    "header": "Quarterly Results Snapshot (Consolidated) - Dec'25 - QoQ",
    "rhs": [
      {
        "prefix": "Net Sales ",
        "suffix": "QoQ Growth in quarter ended Dec 2025 is 2.94% vs 6.38% in Sep 2025",
        "dir": -1
      },
      {
        "prefix": "Consolidated Net Profit ",
        "suffix": "QoQ Growth in quarter ended Dec 2025 is -21.49% vs 14.83% in Sep 2025",
        "dir": -1
      }
    ],
    "table": {
      "header": [
        "Dec'25",
        "Sep'25",
        "Change(%)"
      ],
      "body": [
        {
          "field": "Net Sales",
          "val1": "17,973.49",
          "val2": "17,460.82",
          "chgp": "2.94%",
          "chgp_class": "positive"
        },
        {
          "field": "Operating Profit (PBDIT) excl Other Income",
          "val1": "2,018.34",
          "val2": "2,428.94",
          "chgp": "-16.90%",
          "chgp_class": "negative"
        },
        {
          "field": "Interest",
          "val1": "27.21",
          "val2": "16.66",
          "chgp": "63.33%",
          "chgp_class": "negative"
        },
        {
          "field": "Exceptional Items",
          "val1": "0.00",
          "val2": "0.00",
          "chgp": "",
          "chgp_class": "neutral"
        },
        {
          "field": "Consolidate Net Profit",
          "val1": "1,234.40",
          "val2": "1,572.26",
          "chgp": "-21.49%",
          "chgp_class": "negative"
        },
        {
          "field": "Operating Profit Margin (Excl OI)",
          "val1": "11.46%",
          "val2": "14.16%",
          "chgp": "-2.70%",
          "chgp_class": "negative"
        }
      ]
    }
  },
  {
    "link": "half-yearly",
    "btn_text": "All Half Yearly Results",
    "header": "Half Yearly Results Snapshot (Consolidated) - Sep'25",
    "rhs": [
      {
        "prefix": "Net Sales ",
        "suffix": " Growth in half year ended Sep 2025 is -2.11% vs 3.97% in Sep 2024",
        "dir": -1
      },
      {
        "prefix": "Consolidated Net Profit ",
        "suffix": " Growth in half year ended Sep 2025 is 2.67% vs -3.13% in Sep 2024",
        "dir": 1
      }
    ],
    "table": {
      "header": [
        "Sep'25",
        "Sep'24",
        "Change(%)"
      ],
      "body": [
        {
          "field": "Net Sales",
          "val1": "33,873.70",
          "val2": "34,604.62",
          "chgp": "-2.11%",
          "chgp_class": "negative"
        },
        {
          "field": "Operating Profit (PBDIT) excl Other Income",
          "val1": "4,614.17",
          "val2": "4,545.57",
          "chgp": "1.51%",
          "chgp_class": "positive"
        },
        {
          "field": "Interest",
          "val1": "41.39",
          "val2": "60.81",
          "chgp": "-31.94%",
          "chgp_class": "positive"
        },
        {
          "field": "Exceptional Items",
          "val1": "0.00",
          "val2": "0.00",
          "chgp": "",
          "chgp_class": "neutral"
        },
        {
          "field": "Consolidate Net Profit",
          "val1": "2,941.49",
          "val2": "2,865.12",
          "chgp": "2.67%",
          "chgp_class": "positive"
        },
        {
          "field": "Operating Profit Margin (Excl OI)",
          "val1": "13.84%",
          "val2": "13.33%",
          "chgp": "0.51%",
          "chgp_class": "positive"
        }
      ]
    }
  },
  {
    "link": "nine-monthly",
    "btn_text": "All Nine Monthly Results",
    "header": "Nine Monthly Results Snapshot (Consolidated) - Dec'25",
    "rhs": [
      {
        "prefix": "Net Sales ",
        "suffix": "YoY Growth in nine months ended Dec 2025 is 1.16% vs 2.18% in Dec 2024",
        "dir": -1
      },
      {
        "prefix": "Consolidated Net Profit ",
        "suffix": "YoY Growth in nine months ended Dec 2025 is 3.73% vs -8.15% in Dec 2024",
        "dir": 1
      }
    ],
    "table": {
      "header": [
        "Dec'25",
        "Dec'24",
        "Change(%)"
      ],
      "body": [
        {
          "field": "Net Sales",
          "val1": "51,847.19",
          "val2": "51,252.62",
          "chgp": "1.16%",
          "chgp_class": "positive"
        },
        {
          "field": "Operating Profit (PBDIT) excl Other Income",
          "val1": "6,632.51",
          "val2": "6,421.11",
          "chgp": "3.29%",
          "chgp_class": "positive"
        },
        {
          "field": "Interest",
          "val1": "68.60",
          "val2": "90.70",
          "chgp": "-24.37%",
          "chgp_class": "positive"
        },
        {
          "field": "Exceptional Items",
          "val1": "0.00",
          "val2": "0.00",
          "chgp": "",
          "chgp_class": "neutral"
        },
        {
          "field": "Consolidate Net Profit",
          "val1": "4,175.89",
          "val2": "4,025.85",
          "chgp": "3.73%",
          "chgp_class": "positive"
        },
        {
          "field": "Operating Profit Margin (Excl OI)",
          "val1": "12.79%",
          "val2": "12.53%",
          "chgp": "0.26%",
          "chgp_class": "positive"
        }
      ]
    }
  },
  {
    "link": "annual",
    "btn_text": "All Annual Results",
    "header": "Annual Results Snapshot (Consolidated) - Mar'25",
    "rhs": [
      {
        "prefix": "Net Sales ",
        "suffix": "YoY Growth in year ended Mar 2025 is -0.91% vs 15.79% in Mar 2024",
        "dir": -1
      },
      {
        "prefix": "Consolidated Net Profit ",
        "suffix": "YoY Growth in year ended Mar 2025 is -6.93% vs 28.68% in Mar 2024",
        "dir": -1
      }
    ],
    "table": {
      "header": [
        "Mar'25",
        "Mar'24",
        "Change(%)"
      ],
      "body": [
        {
          "field": "Net Sales",
          "val1": "69,192.89",
          "val2": "69,829.06",
          "chgp": "-0.91%",
          "chgp_class": "negative"
        },
        {
          "field": "Operating Profit (PBDIT) excl Other Income",
          "val1": "8,953.76",
          "val2": "9,132.62",
          "chgp": "-1.96%",
          "chgp_class": "negative"
        },
        {
          "field": "Interest",
          "val1": "127.20",
          "val2": "158.08",
          "chgp": "-19.53%",
          "chgp_class": "positive"
        },
        {
          "field": "Exceptional Items",
          "val1": "0.00",
          "val2": "0.00",
          "chgp": "",
          "chgp_class": "neutral"
        },
        {
          "field": "Consolidate Net Profit",
          "val1": "5,640.21",
          "val2": "6,060.04",
          "chgp": "-6.93%",
          "chgp_class": "negative"
        },
        {
          "field": "Operating Profit Margin (Excl OI)",
          "val1": "13.18%",
          "val2": "13.08%",
          "chgp": "0.10%",
          "chgp_class": "positive"
        }
      ]
    }
  }
]

Quarterly Results Snapshot (Consolidated) - Dec'25 - QoQstock-summary

Dec'25
Sep'25
Change(%)
Net Sales
17,973.49
17,460.82
2.94%
Operating Profit (PBDIT) excl Other Income
2,018.34
2,428.94
-16.90%
Interest
27.21
16.66
63.33%
Exceptional Items
0.00
0.00
Consolidate Net Profit
1,234.40
1,572.26
-21.49%
Operating Profit Margin (Excl OI)
11.46%
14.16%
-2.70%
Values in Rs Cr.
Direction Arrows
Net Sales

QoQ Growth in quarter ended Dec 2025 is 2.94% vs 6.38% in Sep 2025

Direction Arrows
Consolidated Net Profit

QoQ Growth in quarter ended Dec 2025 is -21.49% vs 14.83% in Sep 2025

Half Yearly Results Snapshot (Consolidated) - Sep'25stock-summary

Sep'25
Sep'24
Change(%)
Net Sales
33,873.70
34,604.62
-2.11%
Operating Profit (PBDIT) excl Other Income
4,614.17
4,545.57
1.51%
Interest
41.39
60.81
-31.94%
Exceptional Items
0.00
0.00
Consolidate Net Profit
2,941.49
2,865.12
2.67%
Operating Profit Margin (Excl OI)
13.84%
13.33%
0.51%
Values in Rs Cr.
Direction Arrows
Net Sales

Growth in half year ended Sep 2025 is -2.11% vs 3.97% in Sep 2024

Direction Arrows
Consolidated Net Profit

Growth in half year ended Sep 2025 is 2.67% vs -3.13% in Sep 2024

Nine Monthly Results Snapshot (Consolidated) - Dec'25stock-summary

Dec'25
Dec'24
Change(%)
Net Sales
51,847.19
51,252.62
1.16%
Operating Profit (PBDIT) excl Other Income
6,632.51
6,421.11
3.29%
Interest
68.60
90.70
-24.37%
Exceptional Items
0.00
0.00
Consolidate Net Profit
4,175.89
4,025.85
3.73%
Operating Profit Margin (Excl OI)
12.79%
12.53%
0.26%
Values in Rs Cr.
Direction Arrows
Net Sales

YoY Growth in nine months ended Dec 2025 is 1.16% vs 2.18% in Dec 2024

Direction Arrows
Consolidated Net Profit

YoY Growth in nine months ended Dec 2025 is 3.73% vs -8.15% in Dec 2024

Annual Results Snapshot (Consolidated) - Mar'25stock-summary

Mar'25
Mar'24
Change(%)
Net Sales
69,192.89
69,829.06
-0.91%
Operating Profit (PBDIT) excl Other Income
8,953.76
9,132.62
-1.96%
Interest
127.20
158.08
-19.53%
Exceptional Items
0.00
0.00
Consolidate Net Profit
5,640.21
6,060.04
-6.93%
Operating Profit Margin (Excl OI)
13.18%
13.08%
0.10%
Values in Rs Cr.
Direction Arrows
Net Sales

YoY Growth in year ended Mar 2025 is -0.91% vs 15.79% in Mar 2024

Direction Arrows
Consolidated Net Profit

YoY Growth in year ended Mar 2025 is -6.93% vs 28.68% in Mar 2024

stock-summaryCompany CV
About Hyundai Motor India Ltd stock-summary
stock-summary
Hyundai Motor India Ltd
Large Cap
Automobiles
Hyundai Motor India Limited was incorporated on May 6, 1996 as a Public Limited Company with the name "Hyundai Motor India Limited", pursuant to a Certificate of Incorporation granted by the Registrar of Companies, Tamil Nadu and subsequently, a Certificate of Commencement of Business dated May 10, 1996 was issued to the Company by the Registrar of Companies, Tamil Nadu.
Company Coordinates stock-summary
Icon
No Company Details Available