
Compare Godavari Bioref. with Similar Stocks
Dashboard
Weak Long Term Fundamental Strength with a -7.66% CAGR growth in Operating Profits over the last 5 years
- Low ability to service debt as the company has a high Debt to EBITDA ratio of 4.23 times
- The company has been able to generate a Return on Equity (avg) of 2.06% signifying low profitability per unit of shareholders funds
Positive results in Mar 26
With ROCE of 5.6, it has a Very Attractive valuation with a 1.5 Enterprise value to Capital Employed
Falling Participation by Institutional Investors
Total Returns (Price + Dividend) 
Godavari Bioref. for the last several years.
Risk Adjusted Returns v/s
Returns Beta

News
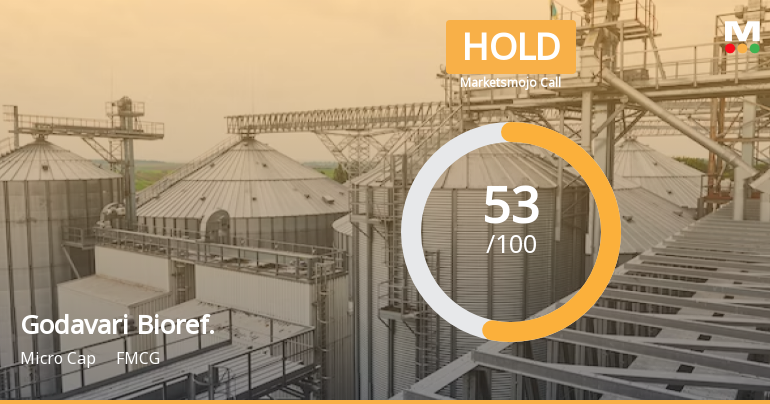
Godavari Biorefineries Ltd is Rated Hold
Godavari Biorefineries Ltd is rated 'Hold' by MarketsMOJO, with this rating last updated on 02 June 2026. However, the analysis and financial metrics discussed here reflect the stock's current position as of 25 June 2026, providing investors with an up-to-date perspective on the company’s fundamentals, valuation, financial trends, and technical outlook.
Read full news article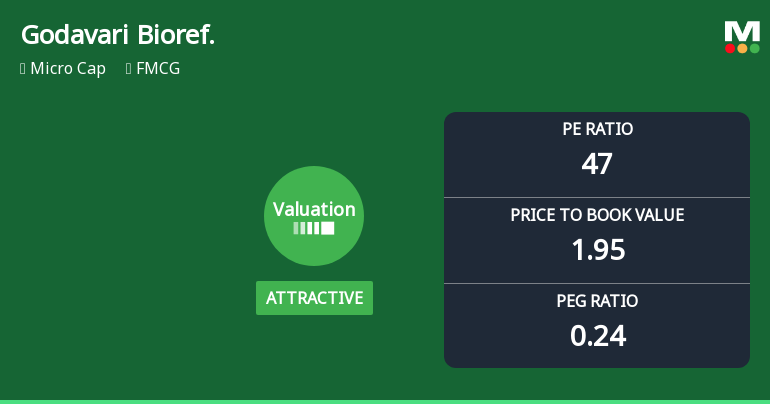
Godavari Biorefineries Ltd Valuation Improves Amid Strong Market Performance
Godavari Biorefineries Ltd has witnessed a notable shift in its valuation parameters, moving from a very attractive to an attractive grade, reflecting a changing perception among investors. With a current price of ₹300.75 and a market cap classified as micro-cap, the company’s price-to-earnings (P/E) and price-to-book value (P/BV) ratios have evolved significantly, prompting a reassessment of its investment appeal within the FMCG sector.
Read full news article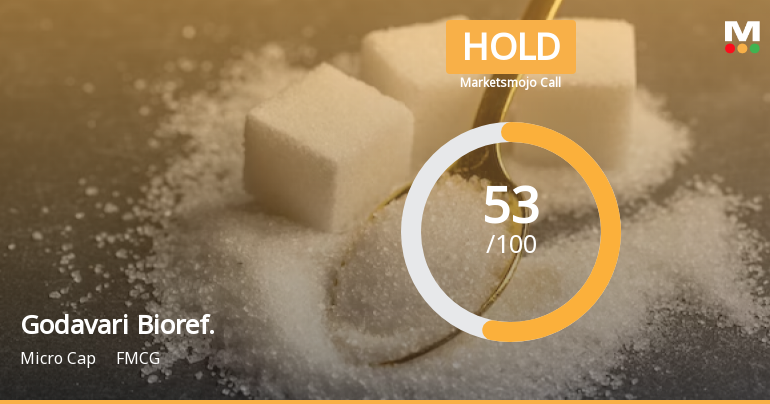
Godavari Biorefineries Ltd is Rated Hold by MarketsMOJO
Godavari Biorefineries Ltd is rated 'Hold' by MarketsMOJO, with this rating last updated on 02 June 2026. However, the analysis and financial metrics discussed here reflect the company’s current position as of 14 June 2026, providing investors with the most up-to-date view of the stock’s fundamentals, returns, and technical outlook.
Read full news article Announcements
Announcement under Regulation 30 (LODR)-Newspaper Publication
19-Jun-2026 | Source : BSENewspaper publication intimation for the Special Window for re-lodgement of the transfer request of physical shares
Announcement Under Regulation 30 Of SEBI (LODR) Regulation-2015-Patent
16-Jun-2026 | Source : BSEThe Japanese Patent Office granted our patent 5-HYDROXY1-4 NAPHTHALENEDIONE for use in cancer
Announcement under Regulation 30 (LODR)-Earnings Call Transcript
02-Jun-2026 | Source : BSEEarning Call Transcript of Q4 and FY26
Corporate Actions

No Upcoming Board Meetings

No Dividend history available

No Splits history available

No Bonus history available

No Rights history available
Quality key factors
Valuation key factors
Technicals key factors
 Technical Indicator Scale: Bearish, Mildly Bearish, Sideways, Mildly Bullish, Bullish Turned
 Shareholding Snapshot : Mar 2026
Shareholding Compare (%holding)
Promoters
None
Held by 4 Schemes (9.53%)
Held by 5 FIIs (0.98%)
Somaiya Agencies Pvt Ltd (17.3%)
Hdfc Mutual Fund - Hdfc Manufacturing Fund (4%)
21.2%
Quarterly Results Snapshot (Consolidated) - Mar'26 - QoQ

QoQ Growth in quarter ended Mar 2026 is 22.67% vs 6.76% in Dec 2025
QoQ Growth in quarter ended Mar 2026 is 540.97% vs 119.84% in Dec 2025
Half Yearly Results Snapshot (Consolidated) - Sep'25

Growth in half year ended Sep 2025 is 14.29% vs 25.25% in Sep 2024
Growth in half year ended Sep 2025 is 43.02% vs -10.73% in Sep 2024
Nine Monthly Results Snapshot (Consolidated) - Dec'25
YoY Growth in nine months ended Dec 2025 is 10.31% vs 20.47% in Dec 2024
YoY Growth in nine months ended Dec 2025 is 48.23% vs -80.33% in Dec 2024
Annual Results Snapshot (Consolidated) - Mar'26
YoY Growth in year ended Mar 2026 is 6.29% vs 10.88% in Mar 2025
YoY Growth in year ended Mar 2026 is 115.08% vs -290.33% in Mar 2025
About Godavari Biorefineries Ltd

Company Coordinates


