
Compare Rossell Techsys with Similar Stocks
Dashboard
Low ability to service debt as the company has a high Debt to EBITDA ratio of 7.41 times
- Low ability to service debt as the company has a high Debt to EBITDA ratio of 7.41 times
- The company has been able to generate a Return on Capital Employed (avg) of 7.76% signifying low profitability per unit of total capital (equity and debt)
Healthy long term growth as Net Sales has grown by an annual rate of 49.60% and Operating profit at 44.62%
The company has declared Positive results for the last 5 consecutive quarters
With ROCE of 9, it has a Very Expensive valuation with a 8.6 Enterprise value to Capital Employed
Increasing Participation by Institutional Investors
Stock DNA
Aerospace & Defense
INR 3,605 Cr (Small Cap)
180.00
44
0.02%
2.34
14.63%
26.31
Total Returns (Price + Dividend) 
Latest dividend: 0.2 per share ex-dividend date: Sep-17-2025
Risk Adjusted Returns v/s
Returns Beta

News
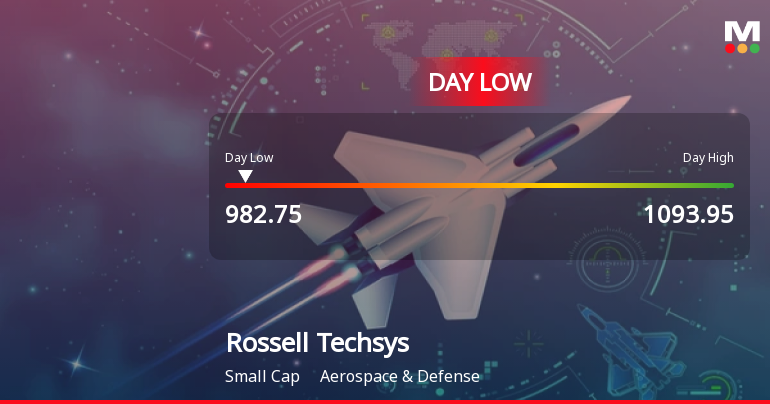
Rossell Techsys Ltd Hits Intraday Low Amid Price Pressure on 23 Jun 2026
Rossell Techsys Ltd experienced a notable decline today, touching an intraday low of Rs 987.25, down 8.81% from its previous close. The stock underperformed its sector and broader market indices, reflecting immediate selling pressure and subdued market sentiment within the Aerospace & Defense sector.
Read full news article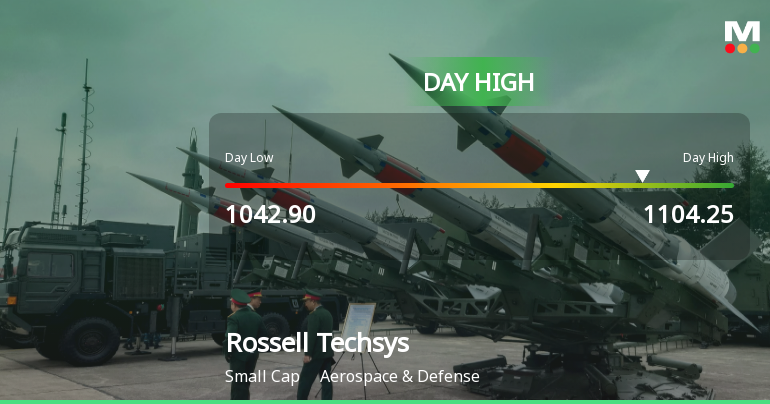
Rossell Techsys Ltd Surges 7.69% to Day's High of Rs 1104.25 — Outperforms Sector by 5.63 Percentage Points
The Sensex advanced 0.59% on 22 Jun 2026, yet Rossell Techsys Ltd outpaced the broader market with a robust 7.69% gain, reaching an intraday high of Rs 1104.25. This 5.63 percentage-point outperformance over its Aerospace & Defense sector peers signals a distinctly stock-specific rally rather than a market-wide lift.
Read full news article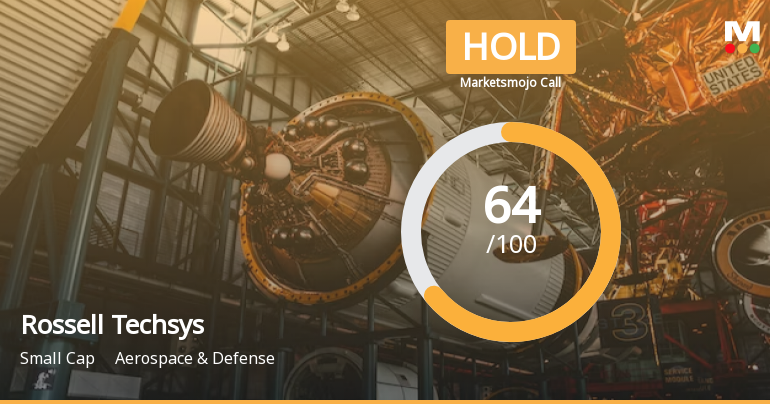
Rossell Techsys Ltd is Rated Hold
Rossell Techsys Ltd is rated 'Hold' by MarketsMOJO, with this rating last updated on 12 May 2026. However, the analysis and financial metrics discussed here reflect the stock's current position as of 15 June 2026, providing investors with an up-to-date view of the company’s performance and prospects.
Read full news article Announcements
Disclosures under Reg. 29(1) of SEBI (SAST) Regulations 2011
19-Jun-2026 | Source : BSEThe Exchange has received the disclosure under Regulation 29(1) of SEBI (Substantial Acquisition of Shares & Takeovers) Regulations 2011 for Harsh Samara Gupta Trust
Disclosures under Reg. 29(2) of SEBI (SAST) Regulations 2011
19-Jun-2026 | Source : BSEThe Exchange has received the disclosure under Regulation 29(2) of SEBI (Substantial Acquisition of Shares & Takeovers) Regulations 2011 for Harsh Mohan Gupta & PACs
Disclosures under Reg. 29(2) of SEBI (SAST) Regulations 2011
19-Jun-2026 | Source : BSEThe Exchange has received the disclosure under Regulation 29(2) of SEBI (Substantial Acquisition of Shares & Takeovers) Regulations 2011 for Harsh Mohan Gupta & PACs
Corporate Actions

No Upcoming Board Meetings

Rossell Techsys Ltd has declared 10% dividend, ex-date: 17 Sep 25

No Splits history available

No Bonus history available

No Rights history available
Quality key factors
Valuation key factors
Technicals key factors
 Technical Indicator Scale: Bearish, Mildly Bearish, Sideways, Mildly Bullish, Bullish Turned
 Shareholding Snapshot : Mar 2026
Shareholding Compare (%holding)
Promoters
None
Held by 2 Schemes (2.37%)
Held by 6 FIIs (1.6%)
Harsh Mohan Gupta (39.49%)
Quant Mutual Fund - Quant Multi Cap Fund (2.37%)
13.79%
Quarterly Results Snapshot (Consolidated) - Mar'26 - QoQ

QoQ Growth in quarter ended Mar 2026 is 9.34% vs 3.19% in Dec 2025
QoQ Growth in quarter ended Mar 2026 is 39.00% vs -4.59% in Dec 2025
Half Yearly Results Snapshot (Standalone) - Sep'25
Not Applicable: The company has declared_date for only one period
Not Applicable: The company has declared_date for only one period
Nine Monthly Results Snapshot (Standalone) - Dec'25
Not Applicable: The company has declared_date for only one period
Not Applicable: The company has declared_date for only one period
Annual Results Snapshot (Consolidated) - Mar'26
YoY Growth in year ended Mar 2026 is 86.82% vs 19.69% in Mar 2025
YoY Growth in year ended Mar 2026 is 176.74% vs -29.44% in Mar 2025
About Rossell Techsys Ltd

Company Coordinates


