
Compare Rossell Techsys with Similar Stocks
Dashboard
Low ability to service debt as the company has a high Debt to EBITDA ratio of 7.41 times
- Low ability to service debt as the company has a high Debt to EBITDA ratio of 7.41 times
- The company has been able to generate a Return on Capital Employed (avg) of 7.76% signifying low profitability per unit of total capital (equity and debt)
Healthy long term growth as Net Sales has grown by an annual rate of 49.60% and Operating profit at 44.62%
The company has declared Positive results for the last 6 consecutive quarters
With ROCE of 9, it has a Very Expensive valuation with a 7.4 Enterprise value to Capital Employed
Falling Participation by Institutional Investors
Stock DNA
Aerospace & Defense
INR 3,456 Cr (Small Cap)
130.00
43
0.02%
2.34
14.63%
22.32
Total Returns (Price + Dividend) 
Latest dividend: 0.2 per share ex-dividend date: Sep-17-2025
Risk Adjusted Returns v/s
Returns Beta

News
Are Rossell Techsys Ltd latest results good or bad?
Rossell Techsys Ltd's latest financial results for Q4 FY26 reveal a complex picture of growth and challenges. The company reported its highest-ever quarterly revenue of ₹142.07 crores, reflecting a substantial year-on-year growth of 61.57% and a sequential increase of 9.34%. This growth is indicative of the company's strong positioning within the aerospace and defence sector, benefiting from India's push for defence indigenisation and robust order execution. However, the operational performance raises concerns regarding profitability. The operating margin, excluding other income, contracted to 11.35% from 13.27% in the previous quarter, indicating pressures from rising input costs and potential inefficiencies. Additionally, net profit after tax reached ₹7.52 crores, which, despite a 39.00% sequential increase, is overshadowed by the fact that a significant portion of this profit was supported by a notable ...
Read full news article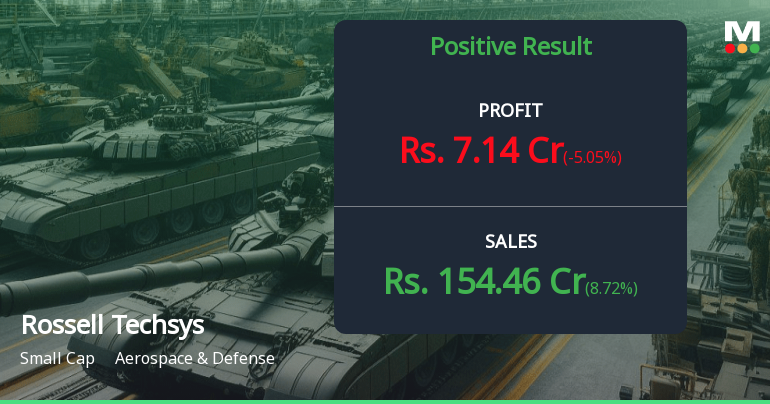
Rossell Techsys Q1 FY27: Strong Growth Meets Valuation Concerns as Defence Play Delivers 116% PAT Surge
Rossell Techsys Ltd., a small-cap aerospace and defence contractor, reported a robust Q1 FY27 performance with net profit surging 116.36% year-on-year to ₹7.14 crores, though the stock tumbled 5.80% to ₹916.75 following the results announcement. The Kolkata-based company, commanding a market capitalisation of ₹3,627 crores, demonstrated strong revenue momentum with sales climbing 77.09% YoY to ₹154.46 crores, marking the highest quarterly revenue since inception. However, the sequential profit decline of 5.05% and mounting interest costs have raised questions about sustainability amidst an already stretched valuation of 130x trailing earnings.
Read full news article
Announcements
Board Meeting Intimation for Inter Alia Approval Of Unaudited Financial Results For The Quarter Ended 30 June 2026
20-Jul-2026 | Source : BSERossell Techsys Ltdhas informed BSE that the meeting of the Board of Directors of the Company is scheduled on 28/07/2026 inter alia to consider and approve inter-alia unaudited financial results for the quarter ended 30 June 2026
Compliances-Certificate under Reg. 74 (5) of SEBI (DP) Regulations 2018
14-Jul-2026 | Source : BSECompliance certificate under Reg. 74(5) of SEBI (DP) Regulations 2018 for the quarter ended 30 June 2026
Closure of Trading Window
30-Jun-2026 | Source : BSEClosure of trading window for the approval of unaudited financial results for the quarter ended 30 June 2026
Corporate Actions

No Upcoming Board Meetings

Rossell Techsys Ltd has declared 10% dividend, ex-date: 17 Sep 25

No Splits history available

No Bonus history available

No Rights history available
Quality key factors
Valuation key factors
Technicals key factors
 Technical Indicator Scale: Bearish, Mildly Bearish, Sideways, Mildly Bullish, Bullish Turned
 Shareholding Snapshot : Jun 2026
Shareholding Compare (%holding)
Promoters
None
Held by 1 Schemes (0.0%)
Held by 7 FIIs (1.68%)
Harsh Mohan Gupta (39.49%)
Ashwini Agarwal (1.89%)
16.39%
Quarterly Results Snapshot (Consolidated) - Jun'26 - QoQ

QoQ Growth in quarter ended Jun 2026 is 8.72% vs 9.34% in Mar 2026
QoQ Growth in quarter ended Jun 2026 is -5.05% vs 39.00% in Mar 2026
Half Yearly Results Snapshot (Standalone) - Sep'25
Not Applicable: The company has declared_date for only one period
Not Applicable: The company has declared_date for only one period
Nine Monthly Results Snapshot (Standalone) - Dec'25
Not Applicable: The company has declared_date for only one period
Not Applicable: The company has declared_date for only one period
Annual Results Snapshot (Consolidated) - Mar'26

YoY Growth in year ended Mar 2026 is 86.82% vs 19.69% in Mar 2025
YoY Growth in year ended Mar 2026 is 176.74% vs -29.44% in Mar 2025
About Rossell Techsys Ltd

Company Coordinates


