
Compare Sanathan Textile with Similar Stocks
Dashboard
Weak Long Term Fundamental Strength with an average Return on Capital Employed (ROCE) of 6.89%
- Poor long term growth as Net Sales has grown by an annual rate of 13.50% and Operating profit at 2.46% over the last 5 years
- Low ability to service debt as the company has a high Debt to EBITDA ratio of 5.32 times
The company has declared Negative results for the last 3 consecutive quarters
Stock DNA
Garments & Apparels
INR 3,796 Cr (Small Cap)
50.00
25
0.00%
0.72
4.13%
2.05
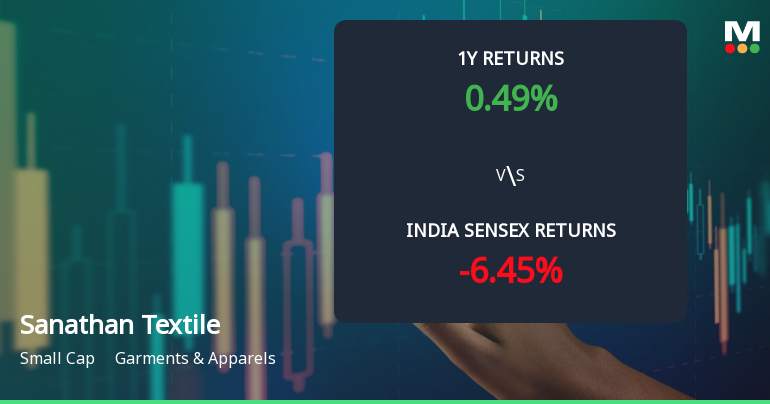
Total Returns (Price + Dividend) 
Sanathan Textile for the last several years.
Risk Adjusted Returns v/s
Returns Beta

News
Sanathan Textiles Ltd Technical Momentum Shifts Amid Mixed Market Signals
Sanathan Textiles Ltd has exhibited a notable shift in its technical momentum, moving from a mildly bearish stance to a more sideways trend, reflecting a complex interplay of bullish and bearish signals across key indicators. Despite a recent 2.81% gain in daily price, the company remains graded as a Strong Sell by MarketsMOJO, underscoring the cautious outlook for this small-cap garment and apparel player.
Read full news article
Sanathan Textiles Ltd is Rated Strong Sell
Sanathan Textiles Ltd is rated Strong Sell by MarketsMOJO. This rating was last updated on 19 May 2026. However, the analysis and financial metrics discussed here reflect the stock's current position as of 22 June 2026, providing investors with the most up-to-date view of the company’s fundamentals, returns, and technical outlook.
Read full news article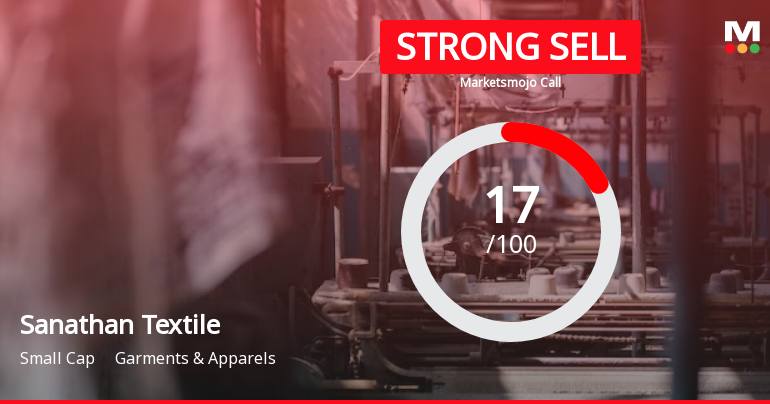
Sanathan Textiles Ltd is Rated Strong Sell
Sanathan Textiles Ltd is rated Strong Sell by MarketsMOJO. This rating was last updated on 19 May 2026, reflecting a significant reassessment of the stock’s outlook. However, all fundamentals, returns, and financial metrics discussed here are current as of 11 June 2026, providing investors with the latest view of the company’s position in the market.
Read full news article Announcements
Announcement under Regulation 30 (LODR)-Analyst / Investor Meet - Intimation
10-Jun-2026 | Source : BSEAnalyst/ Investor meet
Shareholder Meeting / Postal Ballot-Scrutinizers Report
08-Jun-2026 | Source : BSEScrutinizers Report for the Postal Ballot Notice dated April 24 2026
Shareholder Meeting / Postal Ballot-Outcome of Postal_Ballot
08-Jun-2026 | Source : BSEVoting Results for postal ballot notice dated April 24 2026
Corporate Actions

No Upcoming Board Meetings

No Dividend history available

No Splits history available

No Bonus history available

No Rights history available
Quality key factors
Valuation key factors
Technicals key factors
 Technical Indicator Scale: Bearish, Mildly Bearish, Sideways, Mildly Bullish, Bullish Turned
 Shareholding Snapshot : Mar 2026
Shareholding Compare (%holding)
Promoters
None
Held by 5 Schemes (11.94%)
Held by 11 FIIs (1.58%)
A&j Family Trust Trustee Jayshree Anilkumar Dattani (12.41%)
Bandhan Focused Fund (4.98%)
6.41%
Quarterly Results Snapshot (Consolidated) - Mar'26 - QoQ

QoQ Growth in quarter ended Mar 2026 is 8.39% vs 31.87% in Dec 2025

QoQ Growth in quarter ended Mar 2026 is 552.20% vs -123.71% in Dec 2025
Half Yearly Results Snapshot (Consolidated) - Sep'25
Growth in half year ended Sep 2025 is 2.63% vs 7.20% in Sep 2024
Growth in half year ended Sep 2025 is -26.72% vs 74.55% in Sep 2024
Nine Monthly Results Snapshot (Consolidated) - Dec'25
YoY Growth in nine months ended Dec 2025 is 16.57% vs 2.96% in Dec 2024
YoY Growth in nine months ended Dec 2025 is -52.24% vs 43.15% in Dec 2024
Annual Results Snapshot (Consolidated) - Mar'26
YoY Growth in year ended Mar 2026 is 27.10% vs 1.39% in Mar 2025
YoY Growth in year ended Mar 2026 is -51.79% vs 19.87% in Mar 2025
About Sanathan Textiles Ltd

Company Coordinates


