Gokaldas Exports

  • Market Cap: Small Cap
  • Industry: Garments & Apparels
  • ISIN: INE887G01027
  • NSEID: GOKEX
  • BSEID: 532630
INR
784.30
-26.55 (-3.27%)
BSENSE

Dec 18

BSE+NSE Vol: 1.98 lacs

  • Price Points
  • Score
  • Mojo Parameters
  • Total Return
  • News and Corporate Actions
  • Key factors
  • Shareholding
  • Financials
  • CompanyCV
stock-summaryPrice Point
High/Low

1Day

52 Week

Valuation
Technical
Day's Volume

CASH

1.98 lacs (12.52%) Volume

Shareholding (Sep 2025)

FII

22.93%

Held by 105 FIIs

DII

0.49%

Held by 43 DIIs

Promoter

9.16%

Who are the top shareholders of the Gokaldas Exports?

06-Jun-2025

The top shareholders of Gokaldas Exports include mutual funds (30.14%), foreign institutional investors (25.79%), and individual investors (19.24%). Clear Wealth Consultancy Services LLP is the largest promoter with 9.03%, while Nippon Life India Trustee Ltd is the largest public shareholder at 7.55%.

The top shareholders of Gokaldas Exports include a mix of mutual funds, foreign institutional investors (FIIs), and individual investors. The majority of the shares are held by mutual funds, accounting for 30.14% of the total shares through 17 different schemes. Foreign institutional investors hold 25.79% of the shares, represented by 114 FIIs.<BR><BR>Among the promoters, Clear Wealth Consultancy Services LLP has the highest holding at 9.03%. The highest public shareholder is Nippon Life India Trustee Ltd, which holds 7.55%. Additionally, individual investors collectively hold 19.24% of the shares.

Read More

What does Gokaldas Exports do?

06-Jun-2025

Gokaldas Exports Ltd is a mid-cap company in the garments industry, specializing in the export of readymade garments. As of March 2025, it reported net sales of ₹1,015 Cr and a net profit of ₹53 Cr, with a market cap of ₹6,859 Cr.

Overview: <BR>Gokaldas Exports Ltd operates in the garments and apparels industry as a mid-cap company, focusing on the export of readymade garments globally.<BR><BR>History: <BR>Gokaldas Exports Ltd was incorporated on March 1, 2004, by converting the former partnership firm Gokaldas India. The latest quarterly results report net sales and net profit for the period ending March 2025.<BR><BR>Financial Snapshot: <BR>Net Sales: 1,015 Cr (Quarterly Results - Mar 2025) <BR>Net Profit: 53 Cr (Quarterly Results - Mar 2025) <BR>Market Cap: Rs 6,859 Cr (Mid Cap)<BR><BR>Key Metrics: <BR>P/E: 44.00 <BR>Industry P/E: 23 <BR>Dividend Yield: 0.00% <BR>Debt Equity: 0.01 <BR>Return on Equity: 6.68% <BR>Price to Book: 3.56 <BR><BR>Contact Details: <BR>Address: 16/2 Prestige Dot Com, Residency Road Bangalore Karnataka : 560025 <BR>Tel: 91-080-22223600/01/02/41272200 <BR>Email: investorcare@gokaldasexports.com <BR>Website: http://www.gokaldasindia.com

Read More

Who are in the management team of Gokaldas Exports?

06-Jun-2025

As of March 2022, the management team of Gokaldas Exports includes Mathew Cyriac (Chairman), Sivaramakrishnan Vilayur Ganapathi (Vice Chairman), Prabhat Kumar Singh (Executive Director), and several independent directors: George Varughese, Bijapurkar Rama, and Shivanandan Ashok Dalvie, along with Executive Director Sundararajan Poorana Seenivasan. The team combines executive and independent members to guide the company's governance and strategy.

As of March 2022, the management team of Gokaldas Exports includes the following members:<BR><BR>1. Mathew Cyriac - Chairman (Non-Executive) & Director (Non-Independent)<BR>2. Sivaramakrishnan Vilayur Ganapathi - Vice Chairman / Executive Director<BR>3. Prabhat Kumar Singh - Executive Director & Whole-time Director<BR>4. George Varughese - Independent Non-Executive Director<BR>5. Bijapurkar Rama - Independent Non-Executive Director<BR>6. Shivanandan Ashok Dalvie - Independent Non-Executive Director<BR>7. Sundararajan Poorana Seenivasan - Executive Director<BR><BR>This team comprises a mix of executive and independent directors, contributing to the governance and strategic direction of the company.

Read More

Has Gokaldas Exports declared dividend?

06-Jun-2025

Yes, Gokaldas Exports Ltd has declared a 20% dividend (₹1 per share) with an ex-date of September 13, 2023. While the dividend yield is 0%, the company has shown strong price returns, particularly a total return of 2716.59% over the past 5 years.

Gokaldas Exports Ltd has declared a 20% dividend.<BR><BR>Dividend Details:<BR>- Percentage announced: 20%<BR>- Amount per share: 1<BR>- Ex-date: 13 Sep 23<BR><BR>Dividend Yield: 0%<BR><BR>Total Returns by Period:<BR>In the last 6 months, Gokaldas Exports experienced a price return of -3.29%, with no dividend return, resulting in a total return of -3.29%.<BR><BR>Over the past year, the company had a price return of 10.1% and no dividend return, leading to a total return of 10.1%.<BR><BR>In the 2-year period, the price return was 105.03% with a dividend return of 0.21%, culminating in a total return of 105.24%.<BR><BR>For the 3-year period, Gokaldas Exports saw a price return of 109.85% and a dividend return of 0.29%, resulting in a total return of 110.14%.<BR><BR>In the last 4 years, the company achieved a price return of 530.26% with a dividend return of 0.70%, leading to a total return of 530.96%.<BR><BR>Finally, over the past 5 years, Gokaldas Exports recorded a remarkable price return of 2714.05% along with a dividend return of 2.54%, resulting in a total return of 2716.59%.<BR><BR>Overall, Gokaldas Exports has declared a dividend while also demonstrating significant price returns over longer periods, although the dividend yield remains low. The total returns indicate strong performance, particularly over the 5-year horizon.

Read More

Who are the peers of the Gokaldas Exports?

03-Jun-2025

Gokaldas Exports' peers include Trent, Page Industries, K P R Mill Ltd, Vedant Fashions, Trident, Pearl Global Ind, V2 Retail, Raymond Lifestyl, and Arvind Fashions. Gokaldas has average management risk, excellent growth, and a 1-year return of 12.75%, lower than V2 Retail's 249.73% but higher than Vedant Fashions' -24.65%.

Peers: The peers of Gokaldas Exports are Trent, Page Industries, K P R Mill Ltd, Vedant Fashions, Trident, Pearl Global Ind, V2 Retail, Raymond Lifestyl, Arvind Fashions.<BR><BR>Quality Snapshot: Excellent management risk is observed at Page Industries, K P R Mill Ltd, and Vedant Fashions, while Good management risk is found at Trent and Pearl Global Ind, and Average management risk is present at Gokaldas Exports, Trident, V2 Retail, Arvind Fashions, and the rest. Growth is Excellent for Gokaldas Exports, K P R Mill Ltd, Pearl Global Ind, and V2 Retail, while Average growth is noted at Arvind Fashions, and Below Average growth is seen at Page Industries, Vedant Fashions, Trident, and the rest. Capital Structure is Excellent for K P R Mill Ltd, Page Industries, and Vedant Fashions, while Average capital structure is found at Gokaldas Exports, Pearl Global Ind, and the rest, with Below Average capital structure at Trent, V2 Retail, and Arvind Fashions.<BR><BR>Return Snapshot: The peer with the highest 1-year return is V2 Retail at 249.73%, while the lowest is Vedant Fashions at -24.65%. Gokaldas Exports has a 1-year return of 12.75%, which is higher than Vedant Fashions but significantly lower than V2 Retail. Additionally, the peers with negative six-month returns include Vedant Fashions, Trident, and Raymond Lifestyl.

Read More

How big is Gokaldas Exports?

24-Jul-2025

As of 24th July, Gokaldas Exports Ltd has a market capitalization of 6,844.00 Cr, with recent net sales of 3,864.24 Cr and a net profit of 158.54 Cr. The company reported shareholder's funds of 1,291.34 Cr and total assets of 2,700.29 Cr for the annual period ending March 2024.

As of 24th July, Gokaldas Exports Ltd has a market capitalization of 6,844.00 Cr, categorizing it as a Mid Cap company.<BR><BR>In the latest four quarters, Gokaldas Exports reported Net Sales of 3,864.24 Cr and a Net Profit of 158.54 Cr.<BR><BR>For the latest annual period ending March 2024, the company had Shareholder's Funds amounting to 1,291.34 Cr and Total Assets of 2,700.29 Cr.

Read More

When is the next results date for Gokaldas Exports?

04-Nov-2025

Gokaldas Exports will announce its results on 11 November 2025.

Gokaldas Exports will declare its results on 11 November 2025.

Read More

Are Gokaldas Exports latest results good or bad?

13-Nov-2025

Gokaldas Exports' latest results are poor, with a 71.31% decline in net profit to ₹8.08 crores, despite a modest 5.96% increase in net sales. Analysts have issued a "SELL" rating due to significant operational challenges and a high tax rate impacting profitability.

Gokaldas Exports' latest results indicate a challenging situation for the company. In the second quarter of FY26, the company reported a net profit of ₹8.08 crores, which is a significant decline of 71.31% year-on-year. While net sales increased modestly by 5.96% to ₹984.35 crores, this growth was overshadowed by a sharp drop in profitability and operating margins. The operating margin fell to 6.56%, marking a multi-quarter low and a notable decrease from previous quarters.<BR><BR>Additionally, the company's heavy reliance on other income to generate profits raises concerns about the sustainability of its core operations. The tax rate was abnormally high at 56.84%, further eroding profitability. Overall, the financial performance reflects significant operational stress, prompting a "SELL" rating from analysts.<BR><BR>In summary, the latest results for Gokaldas Exports are considered poor, highlighting serious challenges in profitability and operational efficiency.

Read More

Is Gokaldas Exports overvalued or undervalued?

14-Nov-2025

As of November 13, 2025, Gokaldas Exports is considered overvalued with a PE ratio of 43.42 and an EV to EBITDA of 18.54, making it expensive compared to peers like Trident and K P R Mill Ltd, despite a recent 1-week return of 8.18%.

As of 13 November 2025, Gokaldas Exports has moved from a valuation grade of very expensive to expensive. The company is currently considered overvalued based on its key financial ratios, including a PE ratio of 43.42, an EV to EBITDA of 18.54, and a PEG ratio of 2.99. These figures indicate that the stock is priced significantly higher than its earnings growth potential.<BR><BR>In comparison to its peers, Gokaldas Exports' valuation stands out as expensive, especially when compared to Trident, which has a PE ratio of 33.64 and an EV to EBITDA of 15.99, and K P R Mill Ltd, which is categorized as very expensive with a PE of 44.36. Despite recent stock performance showing a 1-week return of 8.18% compared to the Sensex's 1.40%, the overall valuation metrics suggest that Gokaldas Exports is not a compelling investment at its current price level.

Read More

How has been the historical performance of Gokaldas Exports?

01-Dec-2025

Gokaldas Exports has shown significant growth in net sales, increasing from 1,174.52 Cr in March 2019 to 3,864.24 Cr in March 2025, with substantial improvements in profitability and total assets during the same period. The company's operating profit rose to 423.90 Cr and profit after tax reached 158.54 Cr by March 2025, reflecting successful operational strategies.

Answer:<BR>The historical performance of Gokaldas Exports shows significant growth in net sales and profitability over the years, culminating in the fiscal year ending March 2025.<BR><BR>Breakdown:<BR>Gokaldas Exports has demonstrated a strong upward trend in net sales, increasing from 1,174.52 Cr in March 2019 to 3,864.24 Cr in March 2025. This growth is reflected in total operating income, which rose from 1,174.52 Cr in March 2019 to 3,864.24 Cr in March 2025. The company's operating profit (PBDIT) also saw substantial growth, reaching 423.90 Cr in March 2025, compared to 83.48 Cr in March 2019. Profit before tax increased from 25.08 Cr in March 2019 to 218.07 Cr in March 2025, while profit after tax reached 158.54 Cr in March 2025, up from 25.58 Cr in March 2019. The company's total assets grew significantly from 923.98 Cr in March 2019 to 3,499.99 Cr in March 2025, indicating a robust expansion in its financial base. Total liabilities also increased, from 923.98 Cr in March 2019 to 3,499.99 Cr in March 2025, reflecting the company's growth strategy. Cash flow from operating activities improved, showing a net cash inflow of 110.00 Cr in March 2025, compared to a net outflow of 9.00 Cr in March 2021. Overall, Gokaldas Exports has shown a consistent improvement in its financial metrics, highlighting its successful operational and strategic initiatives over the years.

Read More

Is Gokaldas Exports technically bullish or bearish?

02-Dec-2025

As of December 1, 2025, the market trend is mildly bearish due to bearish daily moving averages and mixed signals from weekly and monthly indicators, with bearish factors outweighing bullish ones.

As of 1 December 2025, the technical trend has changed from mildly bullish to mildly bearish. The current stance is mildly bearish, driven by the daily moving averages indicating a bearish outlook. The weekly MACD remains bullish, but the monthly MACD is mildly bearish, suggesting mixed signals across different time frames. The Bollinger Bands are mildly bullish on both weekly and monthly charts, which adds some support to the price action. However, the KST shows a bullish weekly trend but is mildly bearish monthly, further contributing to the overall mixed sentiment. The Dow Theory indicates a mildly bearish stance on the weekly chart, while the monthly shows no trend. Overall, the bearish indicators outweigh the bullish ones, leading to a mildly bearish outlook.

Read More

Should I buy, sell or hold Gokaldas Exports?

18-Dec-2025

Why is Gokaldas Exports falling/rising?

18-Dec-2025

As of 18-Dec, Gokaldas Exports Ltd's stock price is Rs 783.40, down 3.28%, with a significant decline of 8.73% over the last six days. Despite strong fundamentals, investor confidence is low, leading to poor stock performance and decreased trading activity.

As of 18-Dec, Gokaldas Exports Ltd's stock price is falling, currently at Rs 783.40, which reflects a decrease of Rs 26.55 or 3.28%. The stock has been underperforming significantly, with a consecutive decline over the last six days, resulting in a total drop of 8.73% during this period. This trend is further highlighted by the stock's performance over various time frames, showing a 1-week decline of 8.57% and a 1-month decline of 15.99%, while the benchmark Sensex has only seen minor declines of 0.40% and 0.23%, respectively.<BR><BR>Today's trading activity indicates that the stock has touched an intraday low of Rs 780, and it is trading below all key moving averages, including the 5-day, 20-day, 50-day, 100-day, and 200-day averages. Additionally, there has been a notable decrease in investor participation, with delivery volume dropping by 42.48% compared to the 5-day average. This lack of interest from investors contributes to the stock's liquidity issues, despite it being liquid enough for trades of a certain size.<BR><BR>While there are positive factors such as the company's strong ability to service debt and healthy long-term growth in net sales and operating profit, these have not been sufficient to counteract the recent negative sentiment surrounding the stock. Over the past year, despite a profit increase of 17.5%, the stock has generated a return of -37.40%, indicating that investor confidence is low, which is reflected in the current price decline.

Read More
iScoreScore
Click here to find our call on this stock
Strong Sell
Sell
Hold
Buy
Strong Buy

MarketsMojo — Loved in India, Now Global

The power of Mojo is now in 29 countries. Explore global equities with the same cutting-edge features you love.

Dashboard
1

Strong ability to service debt as the company has a low Debt to EBITDA ratio of 1.09 times

 
2

Healthy long term growth as Net Sales has grown by an annual rate of 25.78% and Operating profit at 44.70%

3

With ROCE of 8.6, it has a Fair valuation with a 2.3 Enterprise value to Capital Employed

4

96.28% of Promoter Shares are Pledged

5

Underperformed the market in the last 1 year

stock-summaryMojo Parameters
Mojo Parameters
Loading Valuation Snapshot...
Stock DNA
stock-summary
Industry

Garments & Apparels

stock-summary
Market cap

INR 5,784 Cr (Small Cap)

stock-summary
P/E

38.00

stock-summary
Industry P/E

22

stock-summary
Dividend Yield

0.00%

stock-summary
Debt Equity

0.26

stock-summary
Return on Equity

7.09%

stock-summary
Price to Book

2.78

Revenue and Profits:
Net Sales:
984 Cr
(Quarterly Results - Sep 2025)
Net Profit:
8 Cr
stock-summaryTotal Returns
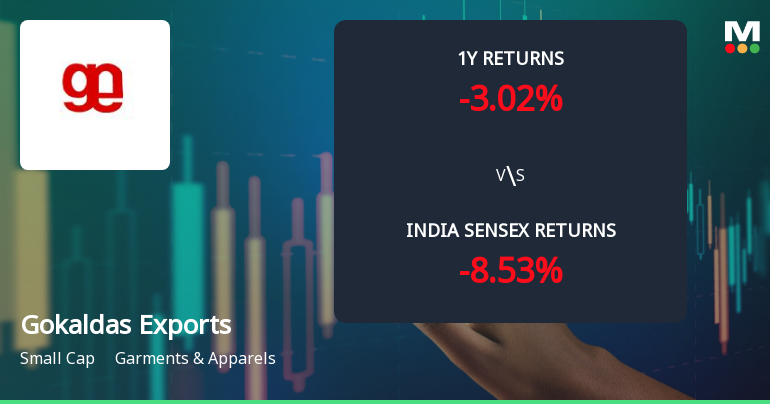
Total Returns (Price + Dividend) stock-summary
Dividend Yield (0%)
TimePeriod
Price Return
Dividend Return
Total Return
3 Months
-4.81%
0%
-4.81%
6 Months
-15.33%
0%
-15.33%
1 Year
-37.25%
0%
-37.25%
2 Years
-12.45%
0%
-12.45%
3 Years
106.53%
0.28%
106.81%
4 Years
175.14%
0.28%
175.42%
5 Years
792.77%
1.13%
793.9%

Latest dividend: 1 per share ex-dividend date: Sep-13-2023

Risk Adjusted Returns v/s stock-summary
Returns Beta
Icon
Beta has not been calculated since enough price history is not available
stock-summaryNews & Corporate Actions
News

Why is Gokaldas Exports falling/rising?

Recent Price Movement and Market Performance

On 17 December, Gokaldas Exports closed at ₹818.90, down by ₹5.25 or 0.64% from the previous session. This decline continues a five-day losing streak, during which the stock has fallen by 4.59%. This underperformance is more pronounced when compared to the broader Sensex, which has gained 0.20% over the same one-week period. The stock’s one-month return of -11.87% also contrasts with the Sensex’s marginal decline of 0.46%, signalling that Gokaldas Exports is lagging behind the benchmark index in the short term.

Over the year-to-date period, the stock has declined by 27.63%, while the Sensex has advanced by 8.22%. Similarly, the one-year return for Gokaldas Exports stands at -33.96%, significantly underperforming the Sensex’s...

Read More
Announcements stock-summary

Gokaldas Exports Limited - Code of Conduct under SEBI(PIT) Reg., 2015

05-Dec-2019 | Source : NSE

Gokaldas Exports Limited has informed the Exchange regarding the Code of Conduct under SEBI(PIT) Reg., 2015- Disclosure under regulation 7(2) read with Regulation 6(2) of Securities and Exchange Board of India (Prohibition of Insider Trading) regulations, 2015

Gokaldas Exports Limited - Analysts/Institutional Investor Meet/Con. Call Updates

03-Dec-2019 | Source : NSE

Gokaldas Exports Limited has informed the Exchange regarding Analysts/Institutional Investor Meet/Con. Call Updates- Investor Meet Intimation

Gokaldas Exports Limited - Updates

21-Nov-2019 | Source : NSE

Gokaldas Exports Limited has informed the Exchange regarding 'Disclosure under Regulation 29(2) read with Regulation 29(3) of the SEBI (Substantial Acquisition of Shares and Takeovers), Regulations, 2011'.

Corporate Actions stock-summary
stock-summary
BOARD MEETING

No Upcoming Board Meetings

stock-summary
DIVIDEND

Gokaldas Exports Ltd has declared 20% dividend, ex-date: 13 Sep 23

stock-summary
SPLITS

Gokaldas Exports Ltd has announced 5:10 stock split, ex-date: 08 Feb 07

stock-summary
BONUS

No Bonus history available

stock-summary
RIGHTS

No Rights history available

stock-summaryKey Factors
Quality key factors stock-summary
Factor
Value
Sales Growth (5y)
25.78%
EBIT Growth (5y)
44.70%
EBIT to Interest (avg)
4.19
Debt to EBITDA (avg)
2.17
Net Debt to Equity (avg)
0.26
Sales to Capital Employed (avg)
1.66
Tax Ratio
31.16%
Dividend Payout Ratio
0
Pledged Shares
96.28%
Institutional Holding
61.88%
ROCE (avg)
17.09%
ROE (avg)
13.33%
Valuation key factors
Factor
Value
P/E Ratio
38
Industry P/E
22
Price to Book Value
2.66
EV to EBIT
26.90
EV to EBITDA
16.24
EV to Capital Employed
2.32
EV to Sales
1.60
PEG Ratio
2.59
Dividend Yield
NA
ROCE (Latest)
8.61%
ROE (Latest)
7.09%
Technicals key factors
Indicator
Weekly
Monthly
MACD
Bullish
Mildly Bearish
RSI
No Signal
No Signal
Bollinger Bands
Bearish
Bearish
Moving Averages
Mildly Bullish (Daily)
KST
Bullish
Mildly Bearish
Dow Theory
Mildly Bearish
Mildly Bullish
OBV
Mildly Bearish
No Trend
stock-summary Technical Indicator Scale: Bearish, Mildly Bearish, Sideways, Mildly Bullish, Bullish  Turned 
stock-summaryShareholding
Shareholding Snapshot : Sep 2025stock-summary
Shareholding Compare (%holding) stock-summary
Majority shareholders

Mutual Funds

Pledged Promoter Holdings

96.2807

Mutual Funds

Held by 17 Schemes (34.24%)

FIIs

Held by 105 FIIs (22.93%)

Promoter with highest holding

Clear Wealth Consultancy Services Llp (8.82%)

Highest Public shareholder

Sbi Mnc Fund (9.73%)

Individual Investors Holdings

18.69%

stock-summaryFinancial
[
  {
    "link": "quarterly",
    "btn_text": "All Quarterly Results",
    "header": "Quarterly Results Snapshot (Consolidated) - Sep'25 - YoY",
    "rhs": [
      {
        "prefix": "Net Sales ",
        "suffix": "YoY Growth in quarter ended Sep 2025 is 5.96% vs 85.71% in Sep 2024",
        "dir": -1
      },
      {
        "prefix": "Consolidated Net Profit ",
        "suffix": "YoY Growth in quarter ended Sep 2025 is -71.31% vs 18.77% in Sep 2024",
        "dir": -1
      }
    ],
    "table": {
      "header": [
        "Sep'25",
        "Sep'24",
        "Change(%)"
      ],
      "body": [
        {
          "field": "Net Sales",
          "val1": "984.35",
          "val2": "929.00",
          "chgp": "5.96%",
          "chgp_class": "positive"
        },
        {
          "field": "Operating Profit (PBDIT) excl Other Income",
          "val1": "64.61",
          "val2": "69.55",
          "chgp": "-7.10%",
          "chgp_class": "negative"
        },
        {
          "field": "Interest",
          "val1": "22.26",
          "val2": "17.98",
          "chgp": "23.80%",
          "chgp_class": "negative"
        },
        {
          "field": "Exceptional Items",
          "val1": "0.00",
          "val2": "0.00",
          "chgp": "",
          "chgp_class": "neutral"
        },
        {
          "field": "Consolidate Net Profit",
          "val1": "8.08",
          "val2": "28.16",
          "chgp": "-71.31%",
          "chgp_class": "negative"
        },
        {
          "field": "Operating Profit Margin (Excl OI)",
          "val1": "6.56%",
          "val2": "7.49%",
          "chgp": "-0.93%",
          "chgp_class": "negative"
        }
      ]
    }
  },
  {
    "link": "half-yearly",
    "btn_text": "All Half Yearly Results",
    "header": "Half Yearly Results Snapshot (Consolidated) - Sep'25",
    "rhs": [
      {
        "prefix": "Net Sales ",
        "suffix": " Growth in half year ended Sep 2025 is 4.24% vs 83.38% in Sep 2024",
        "dir": -1
      },
      {
        "prefix": "Consolidated Net Profit ",
        "suffix": " Growth in half year ended Sep 2025 is -10.44% vs -1.65% in Sep 2024",
        "dir": -1
      }
    ],
    "table": {
      "header": [
        "Sep'25",
        "Sep'24",
        "Change(%)"
      ],
      "body": [
        {
          "field": "Net Sales",
          "val1": "1,940.14",
          "val2": "1,861.14",
          "chgp": "4.24%",
          "chgp_class": "positive"
        },
        {
          "field": "Operating Profit (PBDIT) excl Other Income",
          "val1": "161.91",
          "val2": "144.52",
          "chgp": "12.03%",
          "chgp_class": "positive"
        },
        {
          "field": "Interest",
          "val1": "44.75",
          "val2": "36.78",
          "chgp": "21.67%",
          "chgp_class": "negative"
        },
        {
          "field": "Exceptional Items",
          "val1": "0.00",
          "val2": "0.00",
          "chgp": "",
          "chgp_class": "neutral"
        },
        {
          "field": "Consolidate Net Profit",
          "val1": "49.56",
          "val2": "55.34",
          "chgp": "-10.44%",
          "chgp_class": "negative"
        },
        {
          "field": "Operating Profit Margin (Excl OI)",
          "val1": "8.35%",
          "val2": "7.77%",
          "chgp": "0.58%",
          "chgp_class": "positive"
        }
      ]
    }
  },
  {
    "link": "nine-monthly",
    "btn_text": "All Nine Monthly Results",
    "header": "Nine Monthly Results Snapshot (Consolidated) - Dec'24",
    "rhs": [
      {
        "prefix": "Net Sales ",
        "suffix": "YoY Growth in nine months ended Dec 2024 is 81.87% vs -7.81% in Dec 2023",
        "dir": 1
      },
      {
        "prefix": "Consolidated Net Profit ",
        "suffix": "YoY Growth in nine months ended Dec 2024 is 21.91% vs -31.07% in Dec 2023",
        "dir": 1
      }
    ],
    "table": {
      "header": [
        "Dec'24",
        "Dec'23",
        "Change(%)"
      ],
      "body": [
        {
          "field": "Net Sales",
          "val1": "2,848.91",
          "val2": "1,566.47",
          "chgp": "81.87%",
          "chgp_class": "positive"
        },
        {
          "field": "Operating Profit (PBDIT) excl Other Income",
          "val1": "248.43",
          "val2": "169.55",
          "chgp": "46.52%",
          "chgp_class": "positive"
        },
        {
          "field": "Interest",
          "val1": "55.95",
          "val2": "16.69",
          "chgp": "235.23%",
          "chgp_class": "negative"
        },
        {
          "field": "Exceptional Items",
          "val1": "0.00",
          "val2": "0.00",
          "chgp": "",
          "chgp_class": "neutral"
        },
        {
          "field": "Consolidate Net Profit",
          "val1": "105.68",
          "val2": "86.69",
          "chgp": "21.91%",
          "chgp_class": "positive"
        },
        {
          "field": "Operating Profit Margin (Excl OI)",
          "val1": "8.72%",
          "val2": "10.82%",
          "chgp": "-2.10%",
          "chgp_class": "negative"
        }
      ]
    }
  },
  {
    "link": "annual",
    "btn_text": "All Annual Results",
    "header": "Annual Results Snapshot (Consolidated) - Mar'25",
    "rhs": [
      {
        "prefix": "Net Sales ",
        "suffix": "YoY Growth in year ended Mar 2025 is 62.44% vs 7.05% in Mar 2024",
        "dir": 1
      },
      {
        "prefix": "Consolidated Net Profit ",
        "suffix": "YoY Growth in year ended Mar 2025 is 21.05% vs -24.28% in Mar 2024",
        "dir": 1
      }
    ],
    "table": {
      "header": [
        "Mar'25",
        "Mar'24",
        "Change(%)"
      ],
      "body": [
        {
          "field": "Net Sales",
          "val1": "3,864.24",
          "val2": "2,378.88",
          "chgp": "62.44%",
          "chgp_class": "positive"
        },
        {
          "field": "Operating Profit (PBDIT) excl Other Income",
          "val1": "370.96",
          "val2": "254.00",
          "chgp": "46.05%",
          "chgp_class": "positive"
        },
        {
          "field": "Interest",
          "val1": "77.43",
          "val2": "36.34",
          "chgp": "113.07%",
          "chgp_class": "negative"
        },
        {
          "field": "Exceptional Items",
          "val1": "0.00",
          "val2": "0.00",
          "chgp": "",
          "chgp_class": "neutral"
        },
        {
          "field": "Consolidate Net Profit",
          "val1": "158.54",
          "val2": "130.97",
          "chgp": "21.05%",
          "chgp_class": "positive"
        },
        {
          "field": "Operating Profit Margin (Excl OI)",
          "val1": "9.60%",
          "val2": "10.68%",
          "chgp": "-1.08%",
          "chgp_class": "negative"
        }
      ]
    }
  }
]
Quarterly Results Snapshot (Consolidated) - Sep'25 - YoYstock-summary
Sep'25
Sep'24
Change(%)
Net Sales
984.35
929.00
5.96%
Operating Profit (PBDIT) excl Other Income
64.61
69.55
-7.10%
Interest
22.26
17.98
23.80%
Exceptional Items
0.00
0.00
Consolidate Net Profit
8.08
28.16
-71.31%
Operating Profit Margin (Excl OI)
6.56%
7.49%
-0.93%
Values in Rs Cr.
Direction Arrows
Net Sales

YoY Growth in quarter ended Sep 2025 is 5.96% vs 85.71% in Sep 2024

Direction Arrows
Consolidated Net Profit

YoY Growth in quarter ended Sep 2025 is -71.31% vs 18.77% in Sep 2024

Half Yearly Results Snapshot (Consolidated) - Sep'25stock-summary
Sep'25
Sep'24
Change(%)
Net Sales
1,940.14
1,861.14
4.24%
Operating Profit (PBDIT) excl Other Income
161.91
144.52
12.03%
Interest
44.75
36.78
21.67%
Exceptional Items
0.00
0.00
Consolidate Net Profit
49.56
55.34
-10.44%
Operating Profit Margin (Excl OI)
8.35%
7.77%
0.58%
Values in Rs Cr.
Direction Arrows
Net Sales

Growth in half year ended Sep 2025 is 4.24% vs 83.38% in Sep 2024

Direction Arrows
Consolidated Net Profit

Growth in half year ended Sep 2025 is -10.44% vs -1.65% in Sep 2024

Nine Monthly Results Snapshot (Consolidated) - Dec'24stock-summary
Dec'24
Dec'23
Change(%)
Net Sales
2,848.91
1,566.47
81.87%
Operating Profit (PBDIT) excl Other Income
248.43
169.55
46.52%
Interest
55.95
16.69
235.23%
Exceptional Items
0.00
0.00
Consolidate Net Profit
105.68
86.69
21.91%
Operating Profit Margin (Excl OI)
8.72%
10.82%
-2.10%
Values in Rs Cr.
Direction Arrows
Net Sales

YoY Growth in nine months ended Dec 2024 is 81.87% vs -7.81% in Dec 2023

Direction Arrows
Consolidated Net Profit

YoY Growth in nine months ended Dec 2024 is 21.91% vs -31.07% in Dec 2023

Annual Results Snapshot (Consolidated) - Mar'25stock-summary
Mar'25
Mar'24
Change(%)
Net Sales
3,864.24
2,378.88
62.44%
Operating Profit (PBDIT) excl Other Income
370.96
254.00
46.05%
Interest
77.43
36.34
113.07%
Exceptional Items
0.00
0.00
Consolidate Net Profit
158.54
130.97
21.05%
Operating Profit Margin (Excl OI)
9.60%
10.68%
-1.08%
Values in Rs Cr.
Direction Arrows
Net Sales

YoY Growth in year ended Mar 2025 is 62.44% vs 7.05% in Mar 2024

Direction Arrows
Consolidated Net Profit

YoY Growth in year ended Mar 2025 is 21.05% vs -24.28% in Mar 2024

stock-summaryCompany CV
About Gokaldas Exports Ltd stock-summary
stock-summary
Gokaldas Exports Ltd
Small Cap
Garments & Apparels
Gokaldas Exports Limited (GEL) was incorporated on March 1, 2004 by converting the erstwhile partnership firm Gokaldas India. The Company currently operates a 100% Export Oriented Unit, a Domestic Tariff Area Unit and a Special Economic Zone Unit. GEL is a major player in the readymade garment industry across the globe.
Company Coordinates stock-summary
Company Details
16/2 Prestige Dot Com, Residency Road Bangalore Karnataka : 560025
stock-summary
Tel: 91-080-22223600/01/02/41272200
stock-summary
investorcare@gokaldasexports.com
Registrar Details
Karvy Computershare Pvt Ltd, Plot No 17-24 , Near Image Hospital,, Reliance Cybervilae,Vithalrao Nagar,, Madhapur, Hyderabad