
Compare OneSource Speci. with Similar Stocks
Dashboard
Poor Management Efficiency with a low ROE of 0.80%
- The company has been able to generate a Return on Equity (avg) of 0.80% signifying low profitability per unit of shareholders funds
Company's ability to service its debt is weak with a poor EBIT to Interest (avg) ratio of 0.68
Healthy long term growth as Net Sales has grown by an annual rate of 185.90% and Operating profit at 67.54%
Flat results in Mar 26
With ROCE of 0.3, it has a Very Expensive valuation with a 2.8 Enterprise value to Capital Employed
38.38% of Promoter Shares are Pledged
Stock DNA
Pharmaceuticals & Biotechnology
INR 18,731 Cr (Small Cap)
NA (Loss Making)
37
0.00%
0.24
-1.10%
3.23
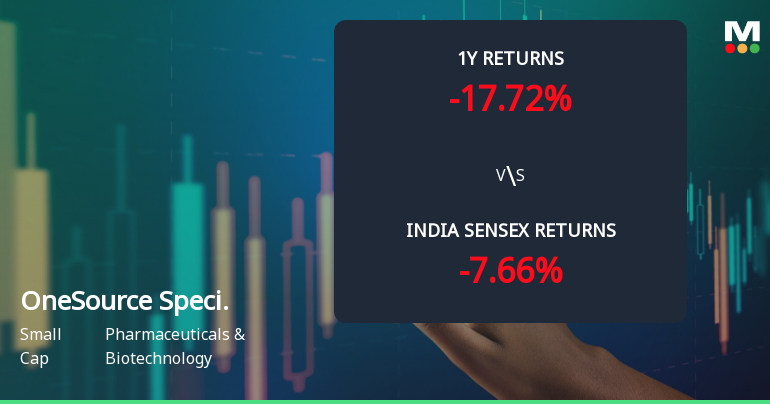
Total Returns (Price + Dividend) 
OneSource Speci. for the last several years.
Risk Adjusted Returns v/s
Returns Beta

News
OneSource Specialty Pharma Ltd Technical Momentum Shifts Amid Mixed Market Signals
OneSource Specialty Pharma Ltd has experienced a notable shift in its technical momentum, moving from a mildly bullish stance to a sideways trend, reflecting a complex interplay of indicator signals. Despite a recent downgrade in its Mojo Grade from Sell to Hold, the stock’s price action and technical indicators suggest a cautious outlook for investors navigating the Pharmaceuticals & Biotechnology sector.
Read full news article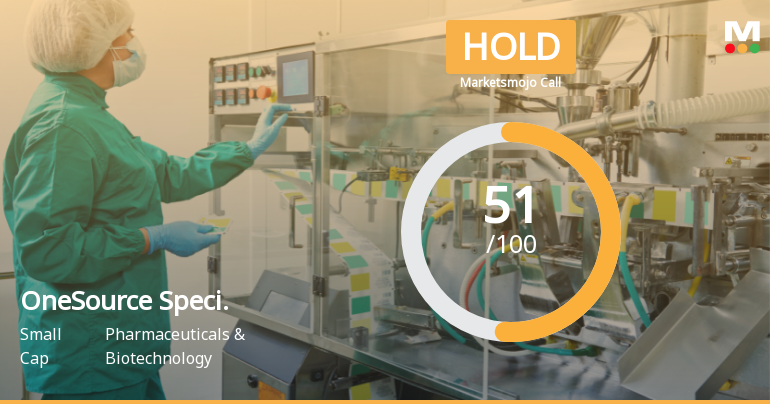
OneSource Specialty Pharma Ltd Upgraded to Hold Amid Mixed Financial and Technical Signals
OneSource Specialty Pharma Ltd has seen its investment rating upgraded from Sell to Hold, reflecting a nuanced improvement across technical indicators and financial trends despite ongoing challenges in profitability and valuation. The upgrade, effective from 22 July 2026, is driven primarily by a shift in technical momentum and a stabilisation in long-term sales growth, signalling cautious optimism for investors in this small-cap pharmaceutical player.
Read full news article
OneSource Specialty Pharma Ltd Shows Mildly Bullish Momentum Amid Mixed Technical Signals
OneSource Specialty Pharma Ltd has shifted from a sideways technical trend to a mildly bullish stance, reflecting a nuanced change in price momentum. Despite mixed signals from key indicators such as MACD, RSI, and moving averages, the stock’s recent performance suggests cautious optimism for investors in the Pharmaceuticals & Biotechnology sector.
Read full news article Announcements
Announcement under Regulation 30 (LODR)-Analyst / Investor Meet - Intimation
21-Jul-2026 | Source : BSEIntimation of Earnings Call to be held on July 25 2026.
Board Meeting Intimation for Approval Of The Unaudited Financial Results For The Quarter Ended June 30 2026.
20-Jul-2026 | Source : BSEOnesource Specialty Pharma Ltdhas informed BSE that the meeting of the Board of Directors of the Company is scheduled on 24/07/2026 inter alia to consider and approve Unaudited financial results (Standalone and Consolidated) for the quarter ended June 30 2026.
Onesource Specialty Pharma And Formycon AG Announce Strategic Manufacturing Partnership For Biosimilars
14-Jul-2026 | Source : BSEOneSource Specialty Pharma and Formycon AG announce Strategic Manufacturing Partnership for Biosimilars
Corporate Actions

(24 Jul 2026)

No Dividend history available

No Splits history available

No Bonus history available

No Rights history available
Quality key factors
Valuation key factors
Technicals key factors
 Technical Indicator Scale: Bearish, Mildly Bearish, Sideways, Mildly Bullish, Bullish Turned
 Shareholding Snapshot : Mar 2026
Shareholding Compare (%holding)
Non Institution
38.3808
Held by 21 Schemes (10.13%)
Held by 136 FIIs (17.5%)
Tenshi Pharmaceuticals Private Limited (18.4%)
Authum Investment And Infrastructure Limited (5.16%)
12.18%
Quarterly Results Snapshot (Consolidated) - Mar'26 - QoQ

QoQ Growth in quarter ended Mar 2026 is 47.49% vs -22.73% in Dec 2025
QoQ Growth in quarter ended Mar 2026 is 105.19% vs -945.57% in Dec 2025
Half Yearly Results Snapshot (Consolidated) - Sep'25
Growth in half year ended Sep 2025 is 380.31% vs 243.83% in Sep 2024
Growth in half year ended Sep 2025 is 114.32% vs 67.44% in Sep 2024
Nine Monthly Results Snapshot (Consolidated) - Dec'25

YoY Growth in nine months ended Dec 2025 is 84.32% vs 445.59% in Dec 2024
YoY Growth in nine months ended Dec 2025 is 44.30% vs 59.90% in Dec 2024
Annual Results Snapshot (Consolidated) - Mar'26
YoY Growth in year ended Mar 2026 is -1.61% vs 740.42% in Mar 2025
YoY Growth in year ended Mar 2026 is -310.68% vs 95.41% in Mar 2025
About OneSource Specialty Pharma Ltd

Company Coordinates


