
Compare Caplin Point Lab with Similar Stocks
Dashboard
High Management Efficiency with a high ROE of 19.33%
The company is Net-Debt Free
Poor long term growth as Operating profit has grown by an annual rate 18.73% of over the last 5 years
The company has declared Positive results for the last 15 consecutive quarters
With ROE of 17.9, it has a Very Expensive valuation with a 5.4 Price to Book Value
Majority shareholders : Promoters
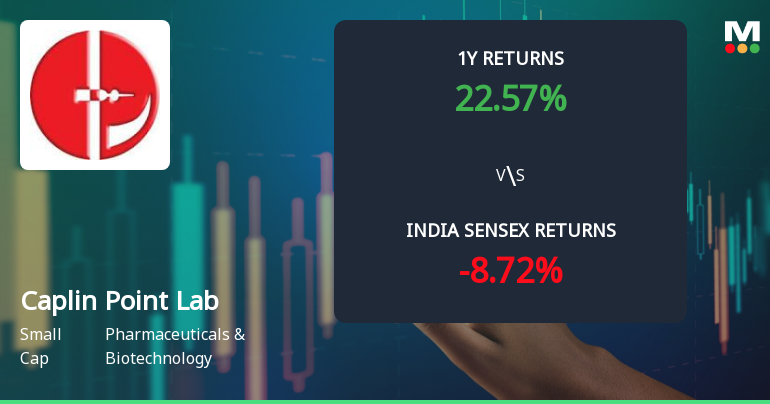
Consistent Returns over the last 3 years
Stock DNA
Pharmaceuticals & Biotechnology
INR 19,862 Cr (Small Cap)
30.00
35
0.27%
-0.28
17.88%
5.42
Total Returns (Price + Dividend) 
Latest dividend: 4 per share ex-dividend date: May-29-2026
Risk Adjusted Returns v/s
Returns Beta

News
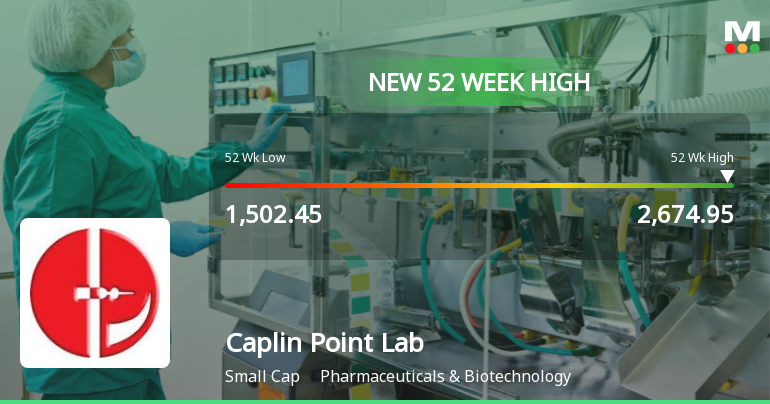
Broad-Based Technical Strength Lifts Caplin Point Laboratories Ltd to 52-Week High of Rs 2653.45
With a decisive surge to Rs 2653.45 on 30 Jun 2026, Caplin Point Laboratories Ltd has reached a fresh 52-week high, extending its impressive 25.89% gain over the past year. This milestone comes amid a backdrop of mixed market conditions, underscoring the stock’s robust technical momentum.
Read full news article
Caplin Point Laboratories Ltd: Technical Momentum Shifts Signal Cautious Outlook
Caplin Point Laboratories Ltd, a small-cap player in the Pharmaceuticals & Biotechnology sector, has experienced a nuanced shift in its technical momentum, reflecting a transition from a bullish to a mildly bullish trend. Recent price movements and technical indicators such as MACD, RSI, and moving averages reveal a complex picture for investors assessing the stock’s near-term trajectory.
Read full news article Announcements
Closure of Trading Window
27-Jun-2026 | Source : BSEIntimation of closure of Trading Window commencing from July 01 2026
Announcement under Regulation 30 (LODR)-Newspaper Publication
22-Jun-2026 | Source : BSENewspaper advertisement for transfer of Unclaimed dividend and shares to IEPF
Compliances-Reg.24(A)-Annual Secretarial Compliance
29-May-2026 | Source : BSEAnnual Secretarial Compliance report for the year ended March 31 2026
Corporate Actions

No Upcoming Board Meetings

Caplin Point Laboratories Ltd has declared 200% dividend, ex-date: 29 May 26

Caplin Point Laboratories Ltd has announced 2:10 stock split, ex-date: 19 Oct 16

No Bonus history available

No Rights history available
Quality key factors
Valuation key factors
Technicals key factors
 Technical Indicator Scale: Bearish, Mildly Bearish, Sideways, Mildly Bullish, Bullish Turned
 Shareholding Snapshot : Mar 2026
Shareholding Compare (%holding)
Promoters
None
Held by 17 Schemes (2.02%)
Held by 134 FIIs (6.15%)
P Vijayalakshmi (24.71%)
Uti Multi Cap Fund (1.85%)
14.46%
Quarterly Results Snapshot (Consolidated) - Mar'26 - YoY

YoY Growth in quarter ended Mar 2026 is 19.45% vs 10.86% in Mar 2025
YoY Growth in quarter ended Mar 2026 is 19.32% vs 17.25% in Mar 2025
Half Yearly Results Snapshot (Consolidated) - Sep'25

Growth in half year ended Sep 2025 is 10.85% vs 16.97% in Sep 2024
Growth in half year ended Sep 2025 is 20.60% vs 16.71% in Sep 2024
Nine Monthly Results Snapshot (Consolidated) - Dec'25
YoY Growth in nine months ended Dec 2025 is 10.59% vs 15.65% in Dec 2024
YoY Growth in nine months ended Dec 2025 is 19.66% vs 17.36% in Dec 2024
Annual Results Snapshot (Consolidated) - Mar'26
YoY Growth in year ended Mar 2026 is 12.89% vs 14.37% in Mar 2025
YoY Growth in year ended Mar 2026 is 19.57% vs 17.33% in Mar 2025
About Caplin Point Laboratories Ltd

Company Coordinates


