
Compare Ajax Engineering with Similar Stocks
Dashboard
High Management Efficiency with a high ROE of 19.41%
The company is Net-Debt Free
Poor long term growth as Operating profit has grown by an annual rate 16.35% of over the last 5 years
The company has declared positive results in Mar'2026 after 3 consecutive negative quarters
With ROE of 16.3, it has a Fair valuation with a 4.7 Price to Book Value
Majority shareholders : Promoters
Stock DNA
Automobiles
INR 6,630 Cr (Small Cap)
29.00
39
0.00%
-0.75
16.34%
4.66
Total Returns (Price + Dividend) 
Ajax Engineering for the last several years.
Risk Adjusted Returns v/s
Returns Beta

News

Ajax Engineering Ltd is Rated Hold
Ajax Engineering Ltd is rated 'Hold' by MarketsMOJO, with this rating last updated on 20 May 2026. However, the analysis and financial metrics discussed here reflect the stock's current position as of 23 June 2026, providing investors with an up-to-date view of the company’s performance and outlook.
Read full news article
Ajax Engineering Ltd Technical Momentum Shifts Signal Mildly Bullish Outlook
Ajax Engineering Ltd, a small-cap player in the automobile sector, has recently exhibited a notable shift in its technical momentum, moving from a sideways trend to a mildly bullish stance. This transition is underscored by mixed signals from key technical indicators such as MACD, RSI, moving averages, and Bollinger Bands, suggesting a cautious yet optimistic outlook for investors.
Read full news article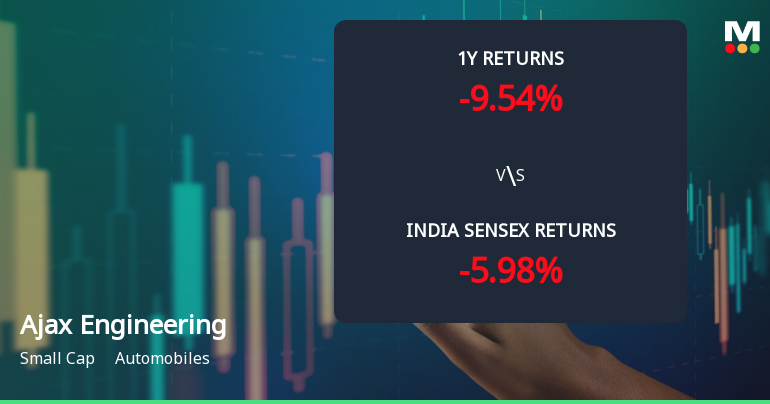
Ajax Engineering Ltd Technical Momentum Shifts Amid Sideways Trend
Ajax Engineering Ltd, a small-cap player in the automobile sector, has experienced a notable shift in its technical momentum, transitioning from a mildly bullish stance to a sideways trend. This change is reflected in a mixed bag of technical indicators, signalling a period of consolidation after recent price movements. Investors and analysts are closely monitoring the stock’s evolving technical profile amid broader market fluctuations.
Read full news article Announcements
Announcement under Regulation 30 (LODR)-Resignation of Director
19-Jun-2026 | Source : BSEResignation of Mr. Rajan Wadhera (DIN: 00416429) as Independent Director of the Company.
Announcement under Regulation 30 (LODR)-Resignation of Director
19-Jun-2026 | Source : BSEResignation of Mr. Rajan Wadhera (DIN: 00416429) as Independent Director of the Company.
Announcement under Regulation 30 (LODR)-Resignation of Chief Financial Officer (CFO)
02-Jun-2026 | Source : BSEResignation of Mr. Ganesh B J as Interim Chief Financial Officer of the Company w.e.f. June 2 2026
Corporate Actions

No Upcoming Board Meetings

No Dividend history available

No Splits history available

No Bonus history available

No Rights history available
Quality key factors
Valuation key factors
Technicals key factors
 Technical Indicator Scale: Bearish, Mildly Bearish, Sideways, Mildly Bullish, Bullish Turned
 Shareholding Snapshot : Mar 2026
Shareholding Compare (%holding)
Promoters
None
Held by 5 Schemes (6.5%)
Held by 38 FIIs (5.65%)
Jacob Jiten John (the Johns Loaves Trust) (19.31%)
Sbi Children's Fund - Investment Plan (4.56%)
3.67%
Quarterly Results Snapshot (Standalone) - Mar'26 - QoQ

QoQ Growth in quarter ended Mar 2026 is 74.76% vs -2.53% in Dec 2025
QoQ Growth in quarter ended Mar 2026 is 148.33% vs -2.12% in Dec 2025
Half Yearly Results Snapshot (Standalone) - Sep'25
Growth in half year ended Sep 2025 is 18.36% vs 12.43% in Sep 2024

Growth in half year ended Sep 2025 is -8.99% vs 21.80% in Sep 2024
Nine Monthly Results Snapshot (Standalone) - Dec'25
YoY Growth in nine months ended Dec 2025 is 2.03% vs -8.62% in Dec 2024
YoY Growth in nine months ended Dec 2025 is -23.04% vs -4.92% in Dec 2024
Annual Results Snapshot (Standalone) - Mar'26
YoY Growth in year ended Mar 2026 is 1.38% vs 19.09% in Mar 2025
YoY Growth in year ended Mar 2026 is -13.44% vs 15.52% in Mar 2025
About Ajax Engineering Ltd

Company Coordinates


