
Compare Ajax Engineering with Similar Stocks
Stock DNA
Automobiles
INR 6,589 Cr (Small Cap)
29.00
37
0.00%
-0.75
16.34%
4.74
Total Returns (Price + Dividend) 
Ajax Engineering for the last several years.
Risk Adjusted Returns v/s
Returns Beta

News

Ajax Engineering Ltd Upgraded to Buy on Strong Technical and Financial Performance
Ajax Engineering Ltd has seen its investment rating upgraded from Hold to Buy, reflecting significant improvements across technical indicators, financial trends, valuation metrics, and overall quality. This upgrade, effective from 29 July 2026, is underpinned by robust quarterly results, a bullish technical outlook, and a favourable risk-reward profile for investors in the small-cap automobile sector.
Read full news article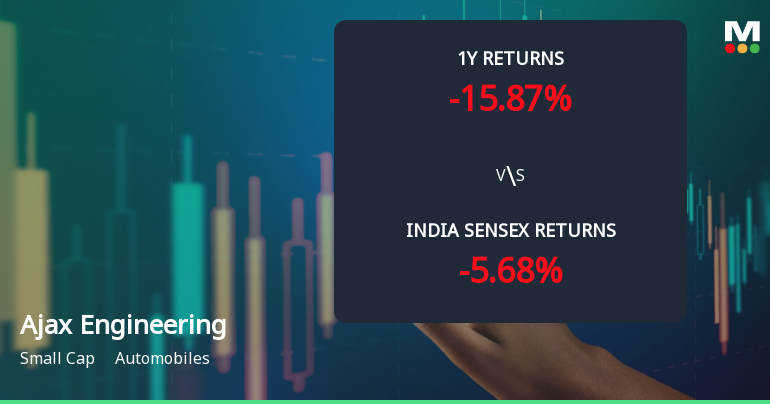
Ajax Engineering Ltd Technical Momentum Shifts to Bullish Amid Mixed Returns
Ajax Engineering Ltd, a small-cap player in the automobile sector, has experienced a notable shift in its technical momentum, moving from a mildly bullish to a bullish stance. Despite recent mixed returns compared to the broader Sensex, the stock’s technical indicators suggest an improving outlook, warranting close attention from investors seeking to navigate the evolving market dynamics.
Read full news article
Ajax Engineering Ltd Downgraded to Hold Amid Mixed Financial and Technical Signals
Ajax Engineering Ltd, a small-cap player in the automobile sector, has seen its investment rating downgraded from Buy to Hold as of 24 July 2026. This revision reflects a nuanced assessment across four key parameters: quality, valuation, financial trend, and technical indicators. While the company posted encouraging quarterly results and maintains strong management efficiency, recent technical signals and subdued long-term returns have tempered investor enthusiasm.
Read full news article Announcements
Compliances-Certificate under Reg. 74 (5) of SEBI (DP) Regulations 2018
15-Jul-2026 | Source : BSECertificate under Reg. 74(5) of SEBI (DP) Regulation 2018 for the quarter ended June 30 2026.
Announcement under Regulation 30 (LODR)-Newspaper Publication
08-Jul-2026 | Source : BSENewspaper Advertisement for Postal Ballot.
Shareholder Meeting / Postal Ballot-Notice of Postal Ballot
07-Jul-2026 | Source : BSENotice of Postal Ballot- Intimation pursuant to Regulation 30 of SEBI (LODR) Regulation 2015.
Corporate Actions

No Upcoming Board Meetings

No Dividend history available

No Splits history available

No Bonus history available

No Rights history available
Quality key factors
Valuation key factors
Technicals key factors
 Technical Indicator Scale: Bearish, Mildly Bearish, Sideways, Mildly Bullish, Bullish Turned
 Shareholding Snapshot : Jun 2026
Shareholding Compare (%holding)
Promoters
None
Held by 5 Schemes (7.44%)
Held by 31 FIIs (4.67%)
Jacob Jiten John (the Johns Loaves Trust) (19.31%)
Sbi Children's Fund - Investment Plan (4.54%)
3.7%
Quarterly Results Snapshot (Standalone) - Mar'26 - QoQ

QoQ Growth in quarter ended Mar 2026 is 74.76% vs -2.53% in Dec 2025
QoQ Growth in quarter ended Mar 2026 is 148.33% vs -2.12% in Dec 2025
Half Yearly Results Snapshot (Standalone) - Sep'25
Growth in half year ended Sep 2025 is 18.36% vs 12.43% in Sep 2024

Growth in half year ended Sep 2025 is -8.99% vs 21.80% in Sep 2024
Nine Monthly Results Snapshot (Standalone) - Dec'25
YoY Growth in nine months ended Dec 2025 is 2.03% vs -8.62% in Dec 2024
YoY Growth in nine months ended Dec 2025 is -23.04% vs -4.92% in Dec 2024
Annual Results Snapshot (Standalone) - Mar'26
YoY Growth in year ended Mar 2026 is 1.38% vs 19.09% in Mar 2025
YoY Growth in year ended Mar 2026 is -13.44% vs 15.52% in Mar 2025
About Ajax Engineering Ltd

Company Coordinates


