
Compare JSW Cement with Similar Stocks
Dashboard
Weak Long Term Fundamental Strength with an average Return on Capital Employed (ROCE) of 6.47%
- Poor long term growth as Net Sales has grown by an annual rate of -0.20% over the last 5 years
- Low ability to service debt as the company has a high Debt to EBITDA ratio of 3.06 times
With a growth in Net Profit of 159.78%, the company declared Very Positive results in Mar 26
With ROCE of 8.9, it has a Expensive valuation with a 2.1 Enterprise value to Capital Employed
Increasing Participation by Institutional Investors
Stock DNA
Cement & Cement Products
INR 18,405 Cr (Small Cap)
25.00
34
0.00%
0.44
11.31%
2.56
Total Returns (Price + Dividend) 
JSW Cement for the last several years.
Risk Adjusted Returns v/s
Returns Beta

News
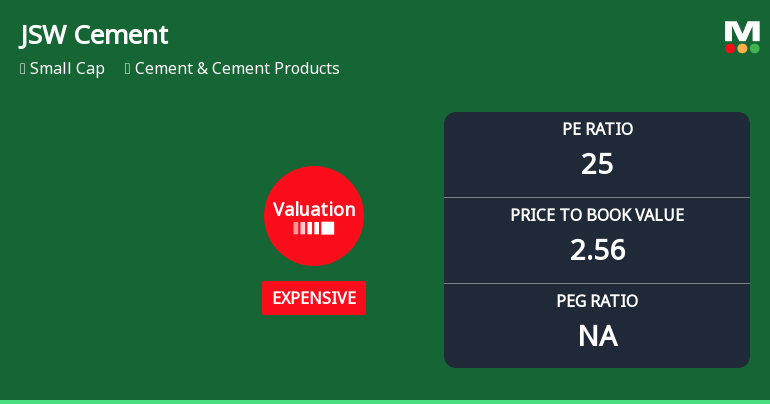
JSW Cement Ltd Valuation Shifts Signal Changing Market Sentiment
JSW Cement Ltd has witnessed a notable shift in its valuation parameters, moving from a fair to an expensive rating, reflecting evolving investor sentiment amid a competitive cement sector landscape. This article analyses the recent changes in key valuation metrics such as price-to-earnings (P/E) and price-to-book value (P/BV) ratios, comparing them with historical averages and peer benchmarks to assess the stock’s price attractiveness.
Read full news article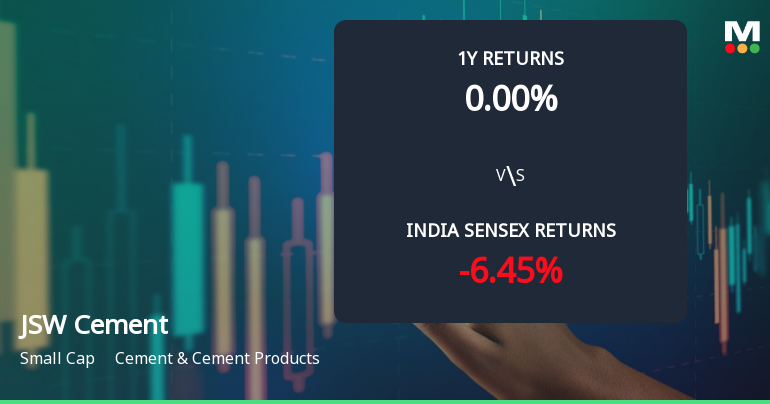
JSW Cement Ltd Technical Momentum Shifts Signal Mildly Bullish Outlook
JSW Cement Ltd has recently exhibited a notable shift in its technical momentum, moving from a sideways trend to a mildly bullish stance. This change is underscored by a combination of technical indicators including MACD, RSI, moving averages, and Bollinger Bands, signalling a potential inflection point for the small-cap cement producer amid a backdrop of mixed returns relative to the broader Sensex index.
Read full news article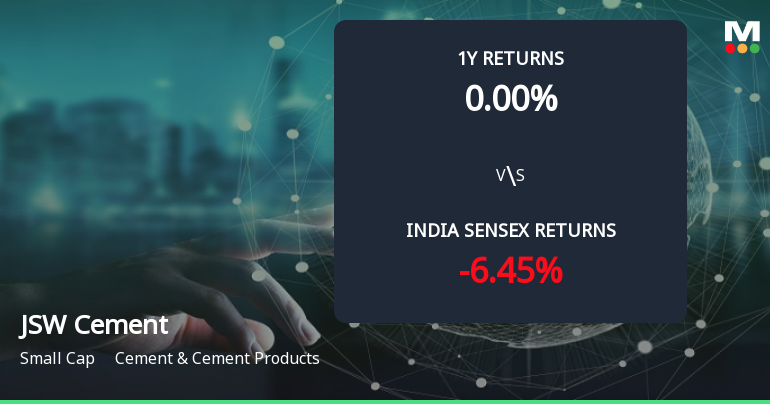
Golden Cross Confirmed: Do JSW Cement Ltd's Other Technical Indicators Agree?
The 50-day moving average has crossed above the 200-day moving average for JSW Cement Ltd, signalling a golden cross on 22 Jun 2026. While this technical event often suggests a shift towards bullish momentum, the broader technical and fundamental context presents a nuanced picture that merits closer examination.
Read full news article Announcements
Announcement under Regulation 30 (LODR)-Newspaper Publication
12-Jun-2026 | Source : BSEPursuant to applicable provisions of SEBI (LODR) Regulations 2015 please find enclosed herewith copies of Newspaper advertisement pertaining to Postal Ballot Notice.
Shareholder Meeting / Postal Ballot-Notice of Postal Ballot
11-Jun-2026 | Source : BSEPursuant to Regulation 30 of SEBI (Listing Obligations and Disclosure Requirements) Regulation 2015 Please find attached the Postal Ballot Notice dated 11th June 2026.
Announcement under Regulation 30 (LODR)-Investor Presentation
28-May-2026 | Source : BSEPursuant to Regulation 30 and other applicable provisions of SEBI (LODR) Regulations 2015 we enclose herewith Investor Presentation.
Corporate Actions

No Upcoming Board Meetings

No Dividend history available

No Splits history available

No Bonus history available

No Rights history available
Quality key factors
Valuation key factors
Technicals key factors
 Technical Indicator Scale: Bearish, Mildly Bearish, Sideways, Mildly Bullish, Bullish Turned
 Shareholding Snapshot : Mar 2026
Shareholding Compare (%holding)
Promoters
0.1018
Held by 21 Schemes (8.04%)
Held by 48 FIIs (2.94%)
Adarsh Advisory Services Pvt Ltd (63.9%)
Sbi Elss Tax Saver Fund (3.61%)
6.6%
Quarterly Results Snapshot (Standalone) - Mar'26 - QoQ

QoQ Growth in quarter ended Mar 2026 is 18.29% vs 11.83% in Dec 2025
QoQ Growth in quarter ended Mar 2026 is 159.78% vs 55.78% in Dec 2025
Half Yearly Results Snapshot (Standalone) - Sep'25
Not Applicable: The company has declared_date for only one period
Not Applicable: The company has declared_date for only one period
Nine Monthly Results Snapshot (Standalone) - Dec'25
Not Applicable: The company has declared_date for only one period
Not Applicable: The company has declared_date for only one period
Annual Results Snapshot (Standalone) - Mar'26
Not Applicable: The company has declared_date for only one period
Not Applicable: The company has declared_date for only one period
About JSW Cement Ltd

Company Coordinates


