
 Price Point
Compare The Ramco Cement with Similar Stocks
ScoreDashboard
Weak Long Term Fundamental Strength with a -14.27% CAGR growth in Operating Profits over the last 5 years
- Low ability to service debt as the company has a high Debt to EBITDA ratio of 2.70 times
- The company has been able to generate a Return on Equity (avg) of 5.43% signifying low profitability per unit of shareholders funds
- PBT LESS OI(Q) At Rs 21.03 cr has Fallen at -80.69%
- PAT(Q) At Rs 21.54 cr has Fallen at -74.7%
- EPS(Q) Lowest at Rs 1.32
With ROCE of 5.9, it has a Expensive valuation with a 2.2 Enterprise value to Capital Employed
Below par performance in long term as well as near term
Mojo ParametersStock DNA

Cement & Cement Products

INR 21,874 Cr (Small Cap)

116.00
34

0.27%

0.45

3.14%

2.74
Total ReturnsTotal Returns (Price + Dividend) 
Latest dividend: 2.5039944903581266 per share ex-dividend date: Aug-13-2026
Risk Adjusted Returns v/s
Returns Beta
 News & Corporate Actions
News
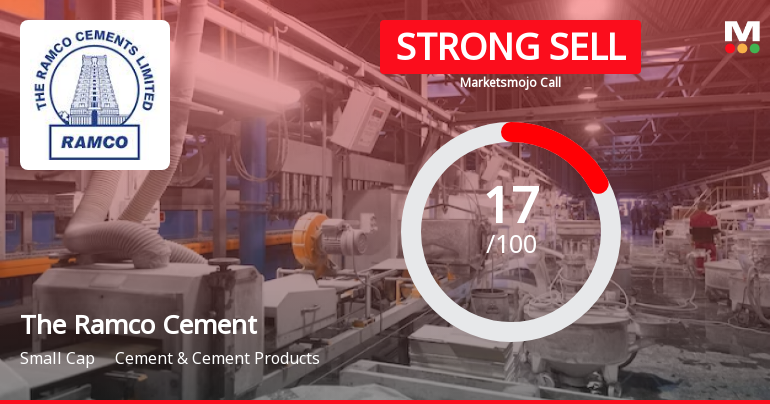
The Ramco Cements Ltd is Rated Strong Sell
The Ramco Cements Ltd is rated Strong Sell by MarketsMOJO, with this rating last updated on 07 August 2026. However, the analysis and financial metrics discussed here reflect the stock's current position as of 24 August 2026, providing investors with the latest insights into its performance and outlook.
Read full news article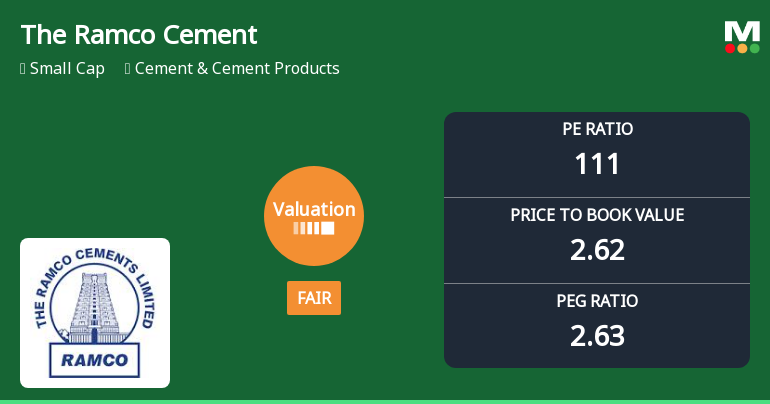
The Ramco Cements Ltd: Valuation Shifts Signal Changing Price Attractiveness
The Ramco Cements Ltd has experienced a notable shift in its valuation parameters, moving from an expensive to a fair valuation grade amid a challenging market backdrop. Despite a recent downgrade to a Strong Sell rating, the stock’s price-to-earnings (P/E) and price-to-book value (P/BV) ratios suggest a nuanced picture of price attractiveness relative to its historical levels and peer group within the cement sector.
Read full news article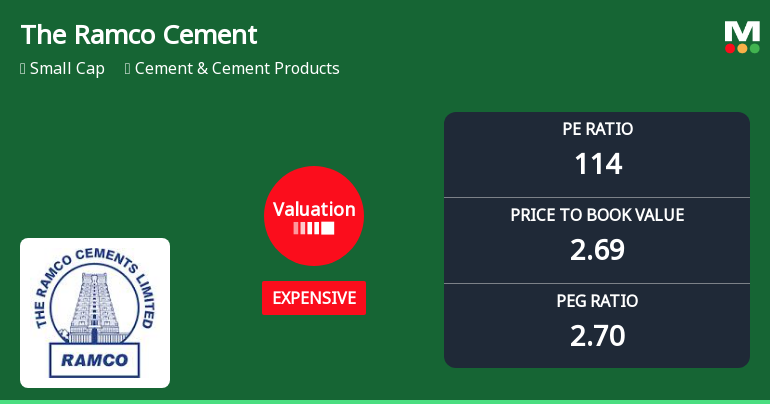
The Ramco Cements Ltd: Valuation Shifts Signal Price Overextension Amid Peer Contrast
The Ramco Cements Ltd has witnessed a marked shift in its valuation parameters, moving from fair to expensive territory, as reflected in its soaring price-to-earnings (P/E) and price-to-book value (P/BV) ratios. This change has prompted a downgrade in its Mojo Grade to Strong Sell, signalling caution for investors amid stretched multiples and subdued returns relative to peers and benchmarks.
Read full news article Announcements
The Ramco Cements Limited - Updates
31-Oct-2019 | Source : NSEThe Ramco Cements Limited has informed the Exchange regarding 'INTIMATION UNDER REG 30(2) OF SEBI LODR'.
The Ramco Cements Limited - Press Release
30-Oct-2019 | Source : NSEThe Ramco Cements Limited has informed the Exchange regarding a press release dated October 30, 2019, titled "PRESS RELEASE".
Trading Window
24-Sep-2019 | Source : NSE
| The Ramco Cements Limited has informed the Exchange regarding the Trading Window closure pursuant to SEBI (Prohibition of Insider Trading) Regulations, 2015 |
Corporate Actions

No Upcoming Board Meetings

The Ramco Cements Ltd has declared 250% dividend, ex-date: 13 Aug 26

The Ramco Cements Ltd has announced 1:10 stock split, ex-date: 01 Oct 08

The Ramco Cements Ltd has announced 1:1 bonus issue, ex-date: 01 Oct 08

No Rights history available
Key FactorsQuality key factors
Valuation key factors
Technicals key factors
 Technical Indicator Scale: Bearish, Mildly Bearish, Sideways, Mildly Bullish, Bullish Turned Shareholding
Shareholding Snapshot : Jun 2026
Shareholding Compare (%holding)
Promoters
22.0601
Held by 24 Schemes (20.31%)
Held by 118 FIIs (7.52%)
Ramco Industries Limited (21.82%)
Life Insurance Corporation Of India And Various Sub Accounts (5.86%)
12.7%
FinancialQuarterly Results Snapshot (Consolidated) - Jun'26 - YoY
 Compare with Peers
YoY Growth in quarter ended Jun 2026 is 9.60% vs -0.93% in Jun 2025

YoY Growth in quarter ended Jun 2026 is -63.27% vs 128.82% in Jun 2025

Half Yearly Results Snapshot (Consolidated) - Sep'25
Growth in half year ended Sep 2025 is 4.23% vs -9.80% in Sep 2024
Growth in half year ended Sep 2025 is 158.30% vs -57.07% in Sep 2024
Nine Monthly Results Snapshot (Consolidated) - Dec'25
YoY Growth in nine months ended Dec 2025 is 4.86% vs -8.61% in Dec 2024
YoY Growth in nine months ended Dec 2025 is 123.44% vs 6.21% in Dec 2024
Annual Results Snapshot (Consolidated) - Mar'26
YoY Growth in year ended Mar 2026 is 5.99% vs -9.15% in Mar 2025
YoY Growth in year ended Mar 2026 is 156.24% vs -24.25% in Mar 2025
 Company CV
About The Ramco Cements Ltd

Company Coordinates










