
Compare Bluestone Jewel with Similar Stocks
Dashboard
Weak Long Term Fundamental Strength with an average Return on Capital Employed (ROCE) of 0%
- Company's ability to service its debt is weak with a poor EBIT to Interest (avg) ratio of -0.81
With a growth in Net Sales of 8.13%, the company declared Very Positive results in Jun 26
With ROCE of 6.1, it has a Very Expensive valuation with a 4.3 Enterprise value to Capital Employed
98.8% of Promoter Shares are Pledged
Stock DNA
Gems, Jewellery And Watches
INR 11,628 Cr (Small Cap)
203.00
54
0.00%
0.64
0.82%
6.34
Total Returns (Price + Dividend) 
Bluestone Jewel for the last several years.
Risk Adjusted Returns v/s
Returns Beta

News
Bluestone Jewellery Sees High-Value Trading Amid Volatility and Institutional Interest
Bluestone Jewellery & Lifestyle Ltd, a prominent player in the Gems, Jewellery and Watches sector, witnessed one of the highest value turnovers on 24 July 2026, with trading volumes surging to over 37 lakh shares and a total traded value exceeding ₹284 crore. Despite this robust activity, the stock closed lower, reflecting heightened volatility and mixed investor sentiment amid shifting institutional interest.
Read full news article
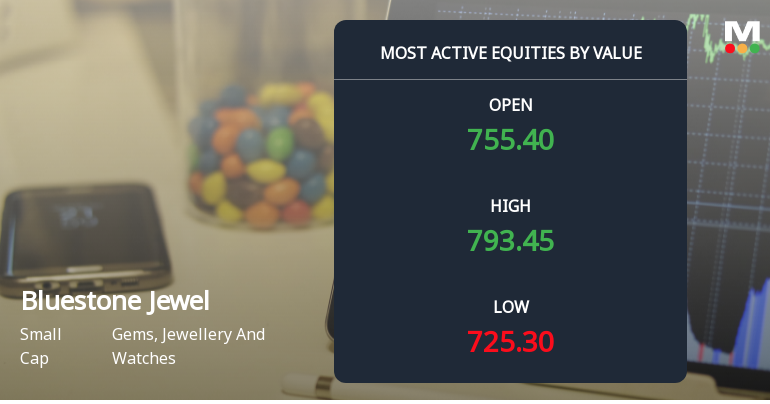
Bluestone Jewellery & Lifestyle Ltd Sees Robust Trading Activity Amid Strong Gains
Bluestone Jewellery & Lifestyle Ltd (BLUESTONE) has emerged as one of the most actively traded stocks by value on 23 July 2026, demonstrating significant investor interest and robust price momentum. The stock outperformed its sector and broader market indices, supported by a notable surge in trading volumes and institutional participation, signalling renewed confidence in the gems and jewellery sector’s small-cap segment.
Read full news article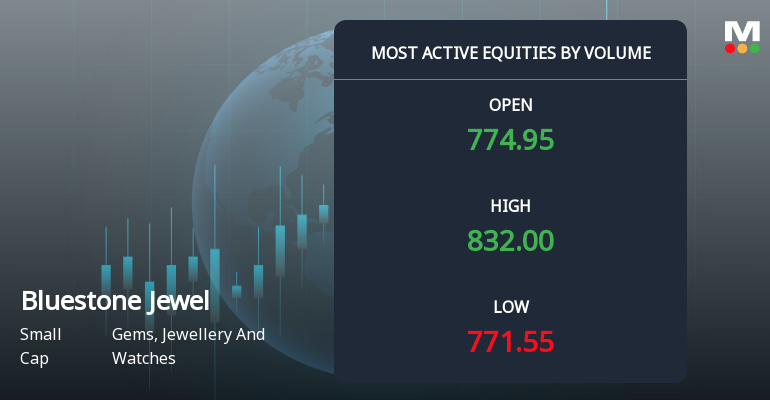
Bluestone Jewellery Sees Exceptional Volume Surge Amid Strong Price Gains
Bluestone Jewellery & Lifestyle Ltd (BLUESTONE) has emerged as one of the most actively traded stocks on 23 July 2026, registering a remarkable surge in volume alongside significant price appreciation. The company’s shares have outperformed both its sector and the broader market, signalling renewed investor interest and potential accumulation in this small-cap gem and jewellery player.
Read full news article Announcements
Announcement under Regulation 30 (LODR)-Newspaper Publication
22-Jul-2026 | Source : BSENewspaper Publication for Unaudited Financial Result for Quarter ended June 30 2026
Announcement under Regulation 30 (LODR)-Analyst / Investor Meet - Outcome
21-Jul-2026 | Source : BSEConference Call Recording for Q1 FY 2026-2027
Statement Of Deviation And Variation For The Quarter Ended June 30 2026
21-Jul-2026 | Source : BSEStatement of Deviation and Variation for the quarter ended June 30 2026
Corporate Actions

No Upcoming Board Meetings

No Dividend history available

No Splits history available

No Bonus history available

No Rights history available
Quality key factors
Valuation key factors
Technicals key factors
 Technical Indicator Scale: Bearish, Mildly Bearish, Sideways, Mildly Bullish, Bullish Turned
 Shareholding Snapshot : Mar 2026
Shareholding Compare (%holding)
FIIs
98.8012
Held by 9 Schemes (6.11%)
Held by 40 FIIs (34.19%)
Gaurav Singh Kushwaha (16.07%)
Accel India Iii (mauritius) Ltd (8.73%)
12.64%
Quarterly Results Snapshot (Consolidated) - Jun'26 - QoQ

QoQ Growth in quarter ended Jun 2026 is 8.13% vs -8.97% in Mar 2026

QoQ Growth in quarter ended Jun 2026 is -78.27% vs -53.63% in Mar 2026
Half Yearly Results Snapshot (Standalone) - Sep'25
Not Applicable: The company has declared_date for only one period
Not Applicable: The company has declared_date for only one period
Nine Monthly Results Snapshot (Standalone) - Dec'25
Not Applicable: The company has declared_date for only one period
Not Applicable: The company has declared_date for only one period
Annual Results Snapshot (Standalone) - Mar'26
YoY Growth in year ended Mar 2026 is 37.92% vs 39.83% in Mar 2025
YoY Growth in year ended Mar 2026 is 111.86% vs -54.11% in Mar 2025
About Bluestone Jewellery & Lifestyle Ltd

Company Coordinates


