
Compare Gem Aromatics with Similar Stocks
Dashboard
Weak Long Term Fundamental Strength with a 12.51% CAGR growth in Operating Profits over the last 5 years
- The company has been able to generate a Return on Equity (avg) of 18.80% signifying low profitability per unit of shareholders funds
The company has declared Negative results for the last 3 consecutive quarters
Stock DNA
Specialty Chemicals
INR 948 Cr (Micro Cap)
655.00
43
0.00%
0.18
5.80%
2.02
Total Returns (Price + Dividend) 
Gem Aromatics for the last several years.
Risk Adjusted Returns v/s
Returns Beta

News

Gem Aromatics Ltd Valuation Shifts Signal Changing Market Perception
Gem Aromatics Ltd, a micro-cap player in the Specialty Chemicals sector, has witnessed a notable shift in its valuation parameters, moving from an attractive to a fair rating. This change reflects evolving market perceptions amid sector-wide valuation pressures and company-specific financial metrics, prompting a reassessment of its price attractiveness relative to peers and historical benchmarks.
Read full news article
Gem Aromatics Ltd is Rated Sell by MarketsMOJO
Gem Aromatics Ltd is rated 'Sell' by MarketsMOJO, with this rating last updated on 05 June 2026. However, the analysis and financial metrics discussed here reflect the company’s current position as of 19 June 2026, providing investors with an up-to-date view of the stock’s fundamentals, returns, and technical outlook.
Read full news article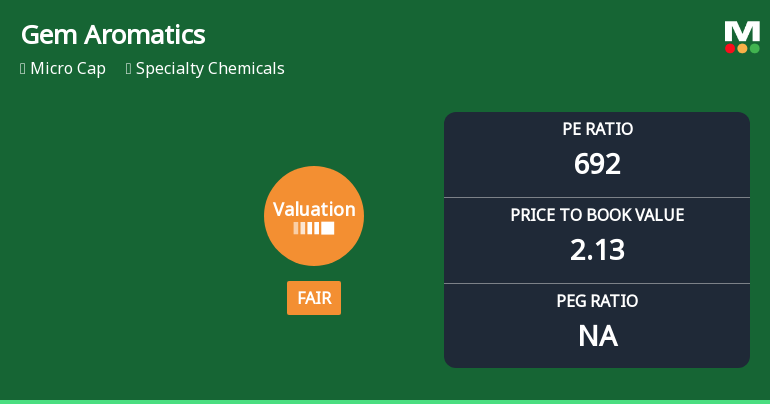
Gem Aromatics Ltd Valuation Shifts Signal Changing Market Perception
Gem Aromatics Ltd, a micro-cap player in the Specialty Chemicals sector, has witnessed a notable shift in its valuation parameters, moving from an attractive to a fair rating. This change reflects evolving market perceptions amid rising price-to-earnings and price-to-book ratios, alongside a recent upgrade in its Mojo Grade from Strong Sell to Sell. Investors are now reassessing the stock’s price attractiveness in the context of sector peers and broader market trends.
Read full news article Announcements
Disclosure Received Under Regulation 29(2) Of SEBI (Substantial Acquisition Of Shares And Takeovers) Regulations 2011.
04-Jun-2026 | Source : BSEDisclosure received under Regulation 29(2) of SEBI (SAST) Regulations 2011.
Announcement under Regulation 30 (LODR)-Code of Conduct under SEBI (PIT) Regulations 2015
04-Jun-2026 | Source : BSEDisclosure as per Regulation 7(2) of SEBI (PIT) Regulations 2015.
Disclosure Received Under Regulation 29(2) Of SEBI (Substantial Acquisition Of Shares And Takeovers) Regulations 2011.
04-Jun-2026 | Source : BSEDisclosure received under Regulation 29(2) of SEBI (SAST) Regulations 2011.
Corporate Actions

No Upcoming Board Meetings

No Dividend history available

No Splits history available

No Bonus history available

No Rights history available
Quality key factors
Valuation key factors
Technicals key factors
 Technical Indicator Scale: Bearish, Mildly Bearish, Sideways, Mildly Bullish, Bullish Turned
 Shareholding Snapshot : Mar 2026
Shareholding Compare (%holding)
Promoters
None
Held by 0 Schemes
Held by 8 FIIs (1.06%)
Parekh Family Trust (20.29%)
Doterra Enterprises S.a.r.l. (18.36%)
14.69%
Quarterly Results Snapshot (Standalone) - Mar'26 - QoQ

QoQ Growth in quarter ended Mar 2026 is 33.78% vs -14.74% in Dec 2025
QoQ Growth in quarter ended Mar 2026 is 181.95% vs 2.43% in Dec 2025
Half Yearly Results Snapshot (Standalone) - Sep'25
Not Applicable: The company has declared_date for only one period
Not Applicable: The company has declared_date for only one period
Nine Monthly Results Snapshot (Standalone) - Dec'25
Not Applicable: The company has declared_date for only one period
Not Applicable: The company has declared_date for only one period
Annual Results Snapshot (Consolidated) - Mar'26

YoY Growth in year ended Mar 2026 is -27.28% vs 11.38% in Mar 2025
YoY Growth in year ended Mar 2026 is -97.32% vs 6.55% in Mar 2025
About Gem Aromatics Ltd

Company Coordinates


