
Compare Gem Aromatics with Similar Stocks
Dashboard
Weak Long Term Fundamental Strength with a 12.51% CAGR growth in Operating Profits over the last 5 years
- The company has been able to generate a Return on Equity (avg) of 18.80% signifying low profitability per unit of shareholders funds
The company has declared Negative results for the last 3 consecutive quarters
Stock DNA
Specialty Chemicals
INR 974 Cr (Micro Cap)
684.00
46
0.00%
0.18
5.80%
2.13
Total Returns (Price + Dividend) 
Gem Aromatics for the last several years.
Risk Adjusted Returns v/s
Returns Beta

News

Gem Aromatics Ltd Upgraded to Sell on Technical Improvement Despite Weak Fundamentals
Gem Aromatics Ltd has seen its investment rating upgraded from Strong Sell to Sell, driven primarily by a shift in technical indicators amid persistent fundamental challenges. While the company’s financial performance remains under pressure, recent market movements and technical signals have prompted a reassessment of its near-term outlook.
Read full news article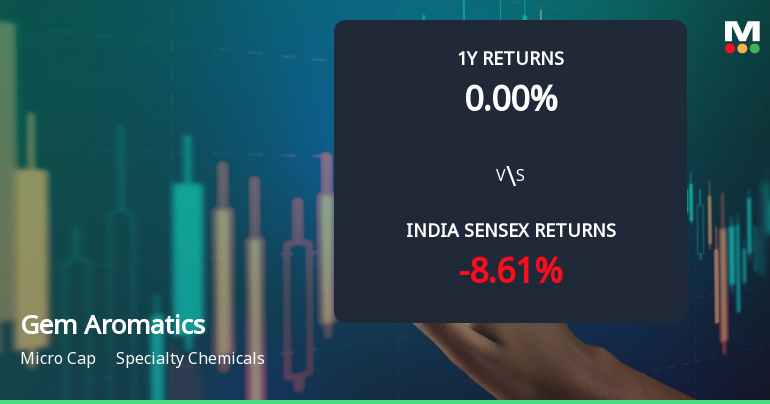
Gem Aromatics Ltd Shows Technical Momentum Shift Amid Mixed Indicators
Gem Aromatics Ltd, a micro-cap player in the Specialty Chemicals sector, has exhibited a notable shift in price momentum, moving from a sideways trend to a mildly bullish stance. Despite a recent upgrade from a Strong Sell to a Sell rating, the stock’s technical indicators present a mixed picture, reflecting both cautious optimism and underlying bearish pressures.
Read full news article
Gem Aromatics Ltd Technical Momentum Shifts Amid Mixed Market Signals
Gem Aromatics Ltd, a micro-cap player in the Specialty Chemicals sector, has experienced a notable shift in its technical momentum, moving from a mildly bullish stance to a sideways trend. Despite a modest day gain of 1.56%, the stock’s technical indicators present a complex picture, reflecting both cautious optimism and underlying bearish pressures as it trades at ₹189.30, well below its 52-week high of ₹349.00.
Read full news article Announcements
Compliances-Certificate under Reg. 74 (5) of SEBI (DP) Regulations 2018
10-Jul-2026 | Source : BSECertificate under Regulation 74(5) of SEBI (DP) Regulations 2018 for the quarter ended June 30 2026.
Closure of Trading Window
25-Jun-2026 | Source : BSEIntimation for Closure of Trading Window for the quarter ending on June 30 2026.
Announcement under Regulation 30 (LODR)-Acquisition
23-Jun-2026 | Source : BSEOutcome of Board Meeting dated June 23 2026
Corporate Actions

No Upcoming Board Meetings

No Dividend history available

No Splits history available

No Bonus history available

No Rights history available
Quality key factors
Valuation key factors
Technicals key factors
 Technical Indicator Scale: Bearish, Mildly Bearish, Sideways, Mildly Bullish, Bullish Turned
 Shareholding Snapshot : Mar 2026
Shareholding Compare (%holding)
Promoters
None
Held by 0 Schemes
Held by 8 FIIs (1.06%)
Parekh Family Trust (20.29%)
Doterra Enterprises S.a.r.l. (18.36%)
14.69%
Quarterly Results Snapshot (Standalone) - Mar'26 - QoQ

QoQ Growth in quarter ended Mar 2026 is 33.78% vs -14.74% in Dec 2025
QoQ Growth in quarter ended Mar 2026 is 181.95% vs 2.43% in Dec 2025
Half Yearly Results Snapshot (Standalone) - Sep'25
Not Applicable: The company has declared_date for only one period
Not Applicable: The company has declared_date for only one period
Nine Monthly Results Snapshot (Standalone) - Dec'25
Not Applicable: The company has declared_date for only one period
Not Applicable: The company has declared_date for only one period
Annual Results Snapshot (Consolidated) - Mar'26

YoY Growth in year ended Mar 2026 is -27.28% vs 11.38% in Mar 2025
YoY Growth in year ended Mar 2026 is -97.32% vs 6.55% in Mar 2025
About Gem Aromatics Ltd

Company Coordinates


