
Compare Dev Accele. with Similar Stocks
Stock DNA
Diversified Commercial Services
INR 344 Cr (Micro Cap)
41.00
32
0.00%
1.70
4.69%
1.86
Total Returns (Price + Dividend) 
Dev Accele. for the last several years.
Risk Adjusted Returns v/s
Returns Beta

News

Dev Accelerator Ltd is Rated Sell
Dev Accelerator Ltd is rated Sell by MarketsMOJO, with this rating last updated on 08 June 2026. However, the analysis and financial metrics discussed here reflect the stock’s current position as of 22 June 2026, providing investors with the latest insights into the company’s fundamentals, valuation, financial trends, and technical outlook.
Read full news article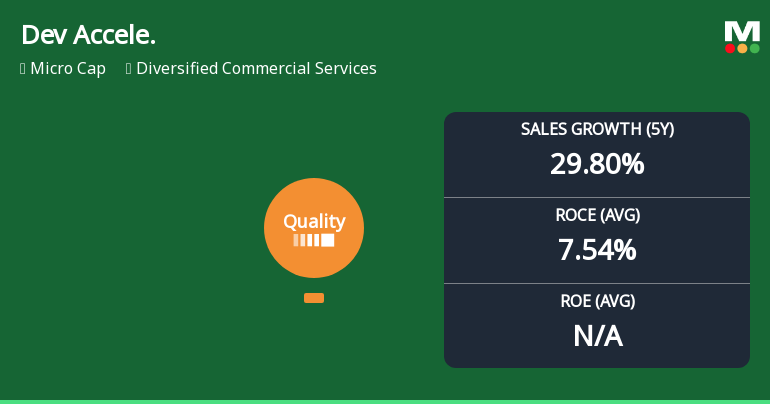
Dev Accelerator Ltd Downgraded to Below Average Quality Amid Deteriorating Fundamentals
Dev Accelerator Ltd, a micro-cap player in the diversified commercial services sector, has seen its quality rating downgraded from average to below average, prompting a downgrade in its Mojo Grade from Hold to Sell. This shift reflects a notable deterioration in key business fundamentals including return ratios, debt levels, and operational efficiency, raising concerns about the company’s medium-term prospects amid challenging market conditions.
Read full news article
Dev Accelerator Ltd is Rated Sell
Dev Accelerator Ltd is rated Sell by MarketsMOJO, with this rating last updated on 8 June 2026. However, the analysis and financial metrics discussed below reflect the stock’s current position as of 11 June 2026, providing investors with the most up-to-date view of the company’s fundamentals, valuation, financial trend, and technical outlook.
Read full news article Announcements
Closure of Trading Window
22-Jun-2026 | Source : BSEClosure of Trading Window
Monthly Newsletter - May 2026 Edition
16-Jun-2026 | Source : BSEA Monthly Newsletter of May 2026 edition issued by the Company is attached.
Board Meeting Outcome for Outcome Of The Board Meeting
16-Jun-2026 | Source : BSEOutcome of the Board Meeting dated June 16 2026
Corporate Actions

No Upcoming Board Meetings

No Dividend history available

No Splits history available

No Bonus history available

No Rights history available
Quality key factors
Valuation key factors
Technicals key factors
 Technical Indicator Scale: Bearish, Mildly Bearish, Sideways, Mildly Bullish, Bullish Turned
 Shareholding Snapshot : Jun 2026
Shareholding Compare (%holding)
Non Institution
None
Held by 0 Schemes
Held by 3 FIIs (1.34%)
Dev Information Technology Limited (15.43%)
Parashwanath Land Organisers Llp (7.17%)
27.73%
Quarterly Results Snapshot (Standalone) - Mar'26 - QoQ

QoQ Growth in quarter ended Mar 2026 is 7.95% vs 4.77% in Dec 2025
QoQ Growth in quarter ended Mar 2026 is 298.88% vs -165.93% in Dec 2025
Half Yearly Results Snapshot (Standalone) - Sep'25
Not Applicable: The company has declared_date for only one period
Not Applicable: The company has declared_date for only one period
Nine Monthly Results Snapshot (Standalone) - Dec'25
Not Applicable: The company has declared_date for only one period
Not Applicable: The company has declared_date for only one period
Annual Results Snapshot (Consolidated) - Mar'26

YoY Growth in year ended Mar 2026 is 42.20% vs 46.98% in Mar 2025
YoY Growth in year ended Mar 2026 is 402.86% vs 306.98% in Mar 2025
About Dev Accelerator Ltd

Company Coordinates


