
Compare Anand Rathi Shar with Similar Stocks
Stock DNA
Capital Markets
INR 3,248 Cr (Small Cap)
22.00
21
0.98%
0.62
9.59%
2.38
Total Returns (Price + Dividend) 
Latest dividend: 4.993700503959683 per share ex-dividend date: Jun-23-2026
Risk Adjusted Returns v/s
Returns Beta

News

Anand Rathi Share & Stock Brokers Ltd Downgraded to Strong Sell Amid Technical Weakness and Institutional Exit
Anand Rathi Share & Stock Brokers Ltd has been downgraded from a Sell to a Strong Sell rating as of 24 July 2026, reflecting deteriorating technical indicators and persistent fundamental weaknesses. Despite recent positive quarterly financial results, the company faces significant headwinds from bearish technical trends, declining institutional participation, and underwhelming long-term returns compared to benchmark indices.
Read full news article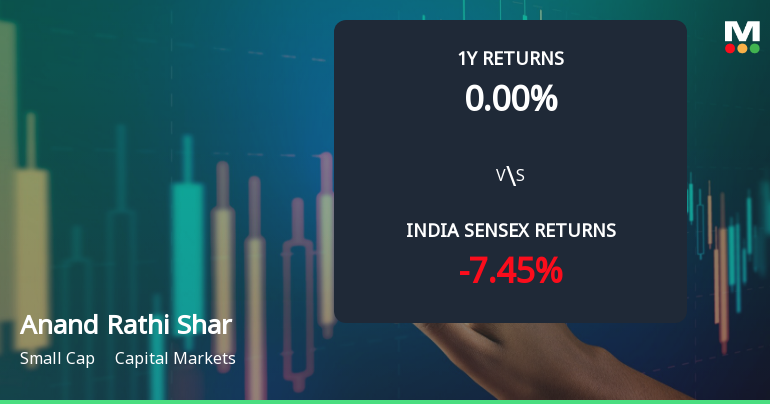
Anand Rathi Share & Stock Brokers Ltd Faces Bearish Momentum Amid Technical Downgrade
Anand Rathi Share & Stock Brokers Ltd, a small-cap player in the capital markets sector, has experienced a notable shift in its technical momentum, moving from a mildly bearish stance to a more pronounced bearish trend. Recent technical indicators such as MACD, RSI, moving averages, and Bollinger Bands signal a deteriorating outlook, reflecting the stock’s underperformance relative to the broader market benchmarks like the Sensex.
Read full news article
Anand Rathi Share & Stock Brokers Ltd Faces Mildly Bearish Momentum Amid Technical Shifts
Anand Rathi Share & Stock Brokers Ltd, a small-cap player in the capital markets sector, has experienced a notable shift in its technical momentum, moving from a sideways trend to a mildly bearish stance. Recent technical indicators, including MACD, RSI, and moving averages, reveal a complex picture that has prompted a downgrade in its MarketsMOJO grade from Hold to Sell as of 15 July 2026.
Read full news article Announcements
Announcement under Regulation 30 (LODR)-Earnings Call Transcript
20-Jul-2026 | Source : BSEIntimation for Earning Call Transcript
Announcement under Regulation 30 (LODR)-Award_of_Order_Receipt_of_Order
17-Jul-2026 | Source : BSEIntimation of Order under Regulation 30
Announcement under Regulation 30 (LODR)-Newspaper Publication
16-Jul-2026 | Source : BSENews Paper Intimation
Corporate Actions

No Upcoming Board Meetings

Anand Rathi Share & Stock Brokers Ltd has declared 100% dividend, ex-date: 23 Jun 26

No Splits history available

No Bonus history available

No Rights history available
Quality key factors
Valuation key factors
Technicals key factors
 Technical Indicator Scale: Bearish, Mildly Bearish, Sideways, Mildly Bullish, Bullish Turned
 Shareholding Snapshot : Jun 2026
Shareholding Compare (%holding)
Promoters
6.1532
Held by 3 Schemes (2.39%)
Held by 7 FIIs (0.15%)
Anand Rathi Financial Services Limited (69.57%)
None
20.9%
Quarterly Results Snapshot (Consolidated) - Jun'26 - QoQ

QoQ Growth in quarter ended Jun 2026 is -3.74% vs 3.00% in Mar 2026
QoQ Growth in quarter ended Jun 2026 is -43.82% vs 12.32% in Mar 2026
Half Yearly Results Snapshot (Standalone) - Sep'25
Not Applicable: The company has declared_date for only one period
Not Applicable: The company has declared_date for only one period
Nine Monthly Results Snapshot (Standalone) - Dec'25
Not Applicable: The company has declared_date for only one period
Not Applicable: The company has declared_date for only one period
Annual Results Snapshot (Standalone) - Mar'26
Not Applicable: The company has declared_date for only one period
Not Applicable: The company has declared_date for only one period
About Anand Rathi Share & Stock Brokers Ltd

Company Coordinates


