
Compare Glottis with Similar Stocks
Stock DNA
Transport Services
INR 614 Cr (Micro Cap)
16.00
39
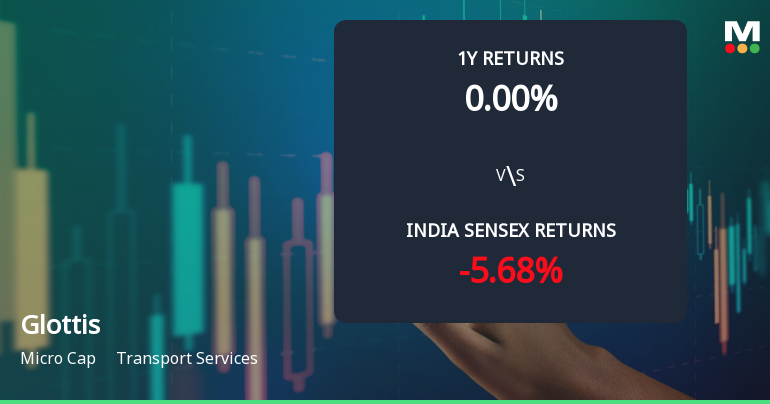
0.00%
-0.17
13.42%
2.20
Total Returns (Price + Dividend) 
Glottis for the last several years.
Risk Adjusted Returns v/s
Returns Beta

News
Glottis Ltd Technical Momentum Shifts Amid Mixed Market Returns
Glottis Ltd, a micro-cap player in the Transport Services sector, has experienced a notable shift in its technical momentum, moving from a sideways trend to a mildly bullish stance. Despite a recent day decline of 1.24%, the stock’s technical indicators reveal a complex picture of emerging strength amid broader market challenges.
Read full news article
Glottis Ltd Technical Momentum Shifts Amid Sideways Trend
Glottis Ltd, a micro-cap player in the Transport Services sector, has experienced a notable shift in its technical momentum, moving from a mildly bullish stance to a sideways trend. Despite a modest decline in its share price, the stock’s year-to-date return of 8.04% outpaces the Sensex’s negative 10.36%, signalling resilience amid broader market weakness. However, recent technical indicators suggest a complex picture for investors weighing the stock’s near-term prospects.
Read full news article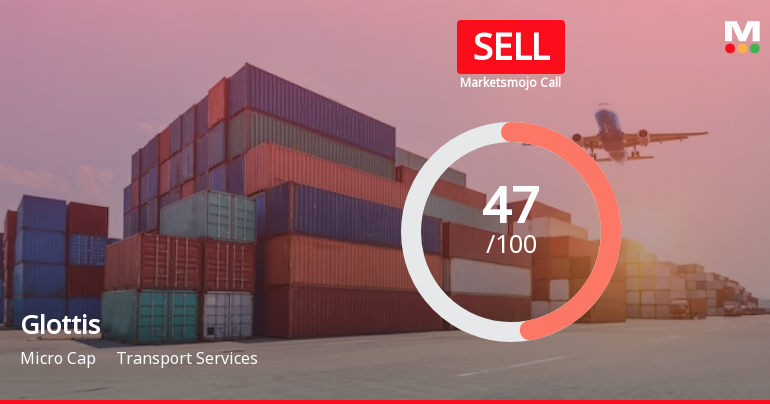
Glottis Ltd is Rated Sell
Glottis Ltd is rated 'Sell' by MarketsMOJO, with this rating last updated on 26 May 2026. However, the analysis and financial metrics discussed here reflect the stock's current position as of 23 July 2026, providing investors with the latest insights into the company’s performance and outlook.
Read full news article Announcements
Compliances-Certificate under Reg. 74 (5) of SEBI (DP) Regulations 2018
07-Jul-2026 | Source : BSEPlease find enclosed the Confirmation Certificate dated 2nd July 2026 received from M/s. KFINTECH Register and Transfer Agent (RTA) of our Company as per Regulation 74 (5) of SEBI (DP) Regulations 2018 for the Quarter ended 30th June 2026.
Disclosure Under The Regulation 30 Of The SEBI (Listing Obligations And Disclosure Requirements) Regulations 2015.
03-Jul-2026 | Source : BSEIntimation of Loan Agreement- Disclosure under the Regulation 30 of the SEBI (Listing Obligations and Disclosure Requirements) Regulations 2015.
Closure of Trading Window
27-Jun-2026 | Source : BSEGlottis Limited has intimated the exchange the Closure of Trading Window for the Quarter ended 30th June 2026. kindly take the same on record.
Corporate Actions

No Upcoming Board Meetings

No Dividend history available

No Splits history available

No Bonus history available

No Rights history available
Quality key factors
Valuation key factors
Technicals key factors
 Technical Indicator Scale: Bearish, Mildly Bearish, Sideways, Mildly Bullish, Bullish Turned
 Shareholding Snapshot : Jun 2026
Shareholding Compare (%holding)
Promoters
None
Held by 0 Schemes
Held by 4 FIIs (0.85%)
K Manikandan (36.68%)
None
18.19%
Quarterly Results Snapshot (Standalone) - Mar'26 - QoQ

QoQ Growth in quarter ended Mar 2026 is 36.13% vs -32.99% in Dec 2025
QoQ Growth in quarter ended Mar 2026 is 296.67% vs -78.16% in Dec 2025
Half Yearly Results Snapshot (Standalone) - Sep'25
Not Applicable: The company has declared_date for only one period
Not Applicable: The company has declared_date for only one period
Nine Monthly Results Snapshot (Standalone) - Dec'25
Not Applicable: The company has declared_date for only one period
Not Applicable: The company has declared_date for only one period
Annual Results Snapshot (Standalone) - Mar'26

YoY Growth in year ended Mar 2026 is -23.22% vs 89.30% in Mar 2025
YoY Growth in year ended Mar 2026 is -32.82% vs 81.36% in Mar 2025
About Glottis Ltd

Company Coordinates


