
Compare Tata Capital with Similar Stocks
Dashboard
Strong Long Term Fundamental Strength with a 0% CAGR growth in Operating Profits
Healthy long term growth as Net Sales has grown by an annual rate of 0% and Operating profit at 0%
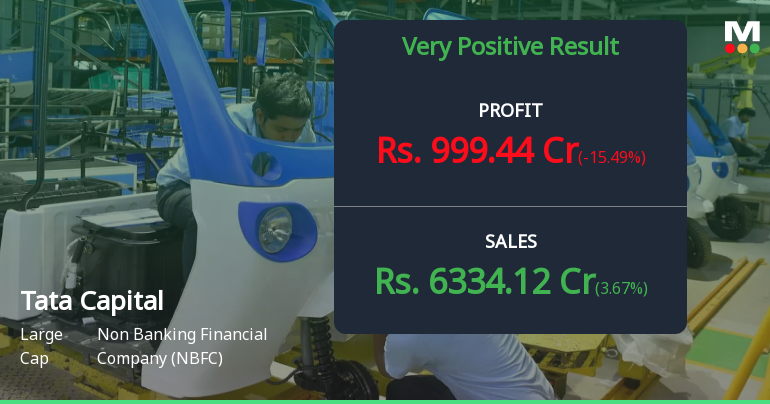
With a growth in Net Sales of 3.67%, the company declared Very Positive results in Jun 26
With ROE of 10.6, it has a Expensive valuation with a 3.3 Price to Book Value
Majority shareholders : Promoters
Stock DNA
Non Banking Financial Company (NBFC)
INR 148,761 Cr (Large Cap)
31.00
21
0.14%
5.15
10.64%
3.25
Total Returns (Price + Dividend) 
Latest dividend: 0.5 per share ex-dividend date: Jul-27-2026
Risk Adjusted Returns v/s
Returns Beta

News
Tata Capital Q1 FY27: Strong Profit Surge Masks Margin Compression Concerns
Tata Capital Limited reported a robust 56.32% year-on-year surge in consolidated net profit to ₹1,547.38 crores for Q1 FY27, marking its strongest quarterly performance to date. However, the impressive headline numbers obscure underlying margin pressures and valuation concerns that have left the stock trading at a modest 1.21% gain following the results announcement, closing at ₹354.95 on July 28, 2026.
Read full news article
Tata Capital Ltd is Rated Hold by MarketsMOJO
Tata Capital Ltd is rated 'Hold' by MarketsMOJO, with this rating last updated on 01 Jul 2026. However, the analysis and financial metrics discussed below reflect the company’s current position as of 24 July 2026, providing investors with an up-to-date view of its fundamentals, valuation, financial trends, and technical outlook.
Read full news article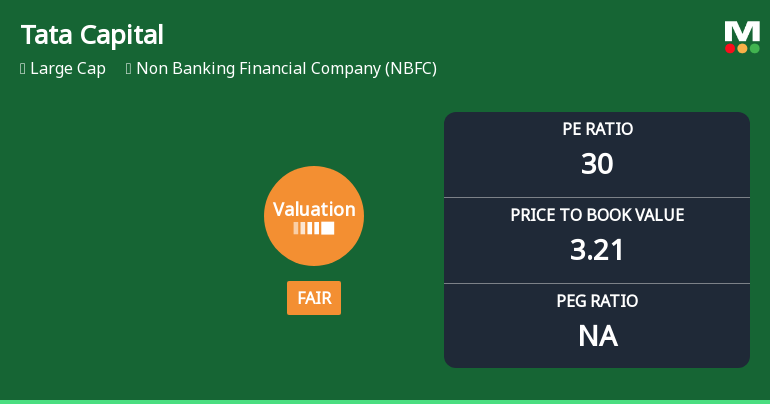
Tata Capital Ltd Valuation Shifts Signal Improved Price Attractiveness
Tata Capital Ltd, a prominent player in the Non Banking Financial Company (NBFC) sector, has witnessed a notable shift in its valuation parameters, moving from an expensive to a fair valuation grade. This recalibration, reflected in key metrics such as the price-to-earnings (P/E) and price-to-book value (P/BV) ratios, suggests a more attractive price point for investors amid a challenging market backdrop.
Read full news article Announcements
Announcement Under Regulations 30 And 51 Of SEBI LODR
25-Jul-2026 | Source : BSEPursuant to Regulation 36(1)(b) and 58(1)(b) of SEBI LODR Regulations 2015 the Company has dispatched letters providing web link and QR Code for accessing the Annual Report for FY 2025-26.
Announcement under Regulation 30 (LODR)-Newspaper Publication
24-Jul-2026 | Source : BSETata Capital Limited has informed the Exchange about Copy of Newspaper Publication.
Regulation 53 (1) Annual Report.
23-Jul-2026 | Source : BSETata Capital Limited has informed the Exchange regarding Annual Report for FY 2025-26.
Corporate Actions

No Upcoming Board Meetings

Tata Capital Ltd has declared 5% dividend, ex-date: 27 Jul 26

No Splits history available

No Bonus history available

No Rights history available
Quality key factors
Valuation key factors
Technicals key factors
 Technical Indicator Scale: Bearish, Mildly Bearish, Sideways, Mildly Bullish, Bullish Turned
 Shareholding Snapshot : Jun 2026
Shareholding Compare (%holding)
Promoters
None
Held by 34 Schemes (1.82%)
Held by 126 FIIs (5.18%)
Tata Sons Private Limited (78.8%)
None
4.56%
Quarterly Results Snapshot (Standalone) - Jun'26 - QoQ

QoQ Growth in quarter ended Jun 2026 is 3.67% vs 5.65% in Mar 2026
QoQ Growth in quarter ended Jun 2026 is -15.49% vs 49.72% in Mar 2026
Half Yearly Results Snapshot (Consolidated) - Sep'25
Growth in half year ended Sep 2025 is 12.17% vs 65.55% in Sep 2024

Growth in half year ended Sep 2025 is 35.76% vs -0.08% in Sep 2024
Nine Monthly Results Snapshot (Consolidated) - Dec'25
YoY Growth in nine months ended Dec 2025 is 12.21% vs 21.72% in Dec 2024
YoY Growth in nine months ended Dec 2025 is 27.98% vs -15.33% in Dec 2024
Annual Results Snapshot (Consolidated) - Mar'26
YoY Growth in year ended Mar 2026 is 11.40% vs 55.77% in Mar 2025
YoY Growth in year ended Mar 2026 is 32.24% vs 16.33% in Mar 2025
About Tata Capital Ltd

Company Coordinates


