
Compare Tata Capital with Similar Stocks
Dashboard
Strong Long Term Fundamental Strength with a 0% CAGR growth in Operating Profits
Healthy long term growth as Net Sales has grown by an annual rate of 0% and Operating profit at 0%
The company has declared Positive results for the last 2 consecutive quarters
With ROE of 10.6, it has a Expensive valuation with a 3.3 Price to Book Value
Increasing Participation by Institutional Investors
Stock DNA
Non Banking Financial Company (NBFC)
INR 149,865 Cr (Large Cap)
31.00
21
0.00%
5.15
10.64%
3.24
Total Returns (Price + Dividend) 
Tata Capital for the last several years.
Risk Adjusted Returns v/s
Returns Beta

News

Tata Capital Ltd is Rated Hold by MarketsMOJO
Tata Capital Ltd is rated 'Hold' by MarketsMOJO, with this rating last updated on 01 July 2026. However, the analysis and financial metrics discussed here reflect the company’s current position as of 13 July 2026, providing investors with the most recent insights into its performance and outlook.
Read full news article
Tata Capital Ltd Surges 3.09% to Day's High of Rs 356.85 — Outperforms NBFC Sector by 1.88 Percentage Points
The Sensex advanced 0.68% on 09 Jul 2026, yet Tata Capital Ltd outpaced the broader market with a 3.09% gain, touching an intraday high of Rs 356.85. This 1.88 percentage-point outperformance over its NBFC sector peers signals a stock-specific strength rather than a mere market tailwind.
Read full news article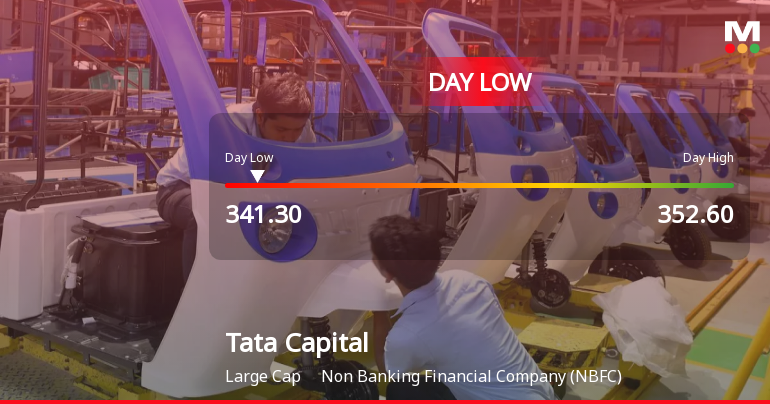
Tata Capital Ltd Hits Intraday Low Amid Price Pressure on 8 July 2026
Tata Capital Ltd experienced a notable decline today, touching an intraday low of Rs 342.8, reflecting a 2.71% drop as the stock faced significant price pressure amid a broadly negative market environment. The stock underperformed its sector and the broader Sensex index, marking a reversal after two days of gains.
Read full news article Announcements
Announcement under Regulation 30 (LODR)-Credit Rating
16-Jul-2026 | Source : BSETata Capital Limited has informed the Exchange about Credit Rating.
Announcement under Regulation 30 (LODR)-Credit Rating
15-Jul-2026 | Source : BSETata Capital Limited has informed the Exchange regarding Credit Rating.
Announcement under Regulation 30 (LODR)-Newspaper Publication
15-Jul-2026 | Source : BSETata Capital Limited has informed the Exchange about Copy of Newspaper Publication.
Corporate Actions

28 Jul 2026

Tata Capital Ltd has declared 5% dividend, ex-date: 27 Jul 26

No Splits history available

No Bonus history available

No Rights history available
Quality key factors
Valuation key factors
Technicals key factors
 Technical Indicator Scale: Bearish, Mildly Bearish, Sideways, Mildly Bullish, Bullish Turned
 Shareholding Snapshot : Jun 2026
Shareholding Compare (%holding)
Promoters
None
Held by 34 Schemes (1.82%)
Held by 126 FIIs (5.18%)
Tata Sons Private Limited (78.8%)
None
4.56%
Quarterly Results Snapshot (Standalone) - Mar'26 - QoQ

QoQ Growth in quarter ended Mar 2026 is 5.65% vs 3.56% in Dec 2025
QoQ Growth in quarter ended Mar 2026 is 49.72% vs 19.57% in Dec 2025
Half Yearly Results Snapshot (Consolidated) - Sep'25

Growth in half year ended Sep 2025 is 12.17% vs 65.55% in Sep 2024
Growth in half year ended Sep 2025 is 35.76% vs -0.08% in Sep 2024
Nine Monthly Results Snapshot (Consolidated) - Dec'25
YoY Growth in nine months ended Dec 2025 is 12.21% vs 26.62% in Dec 2024
YoY Growth in nine months ended Dec 2025 is 27.98% vs -14.07% in Dec 2024
Annual Results Snapshot (Consolidated) - Mar'26
YoY Growth in year ended Mar 2026 is 11.40% vs 55.77% in Mar 2025
YoY Growth in year ended Mar 2026 is 32.24% vs 16.33% in Mar 2025
About Tata Capital Ltd

Company Coordinates


