
Compare Rubicon Research with Similar Stocks
Dashboard
Strong Long Term Fundamental Strength with an average Return on Equity (ROE) of 0%
- Healthy long term growth as Net Sales has grown by an annual rate of 0% and Operating profit at 0%
- Strong ability to service debt as the company has a low Debt to EBITDA ratio of 0.78 times
With a growth in Net Profit of 88.33%, the company declared Outstanding results in Mar 26
Majority shareholders : Promoters
Stock DNA
Pharmaceuticals & Biotechnology
INR 23,578 Cr (Small Cap)
96.00
36
0.00%
-0.03
19.14%
18.05
Total Returns (Price + Dividend) 
Rubicon Research for the last several years.
Risk Adjusted Returns v/s
Returns Beta

News

Rubicon Research Ltd is Rated Strong Buy
Rubicon Research Ltd is rated Strong Buy by MarketsMOJO, with this rating last updated on 01 June 2026. However, the analysis and financial metrics discussed here reflect the stock’s current position as of 16 July 2026, providing investors with the most up-to-date view of its performance and prospects.
Read full news article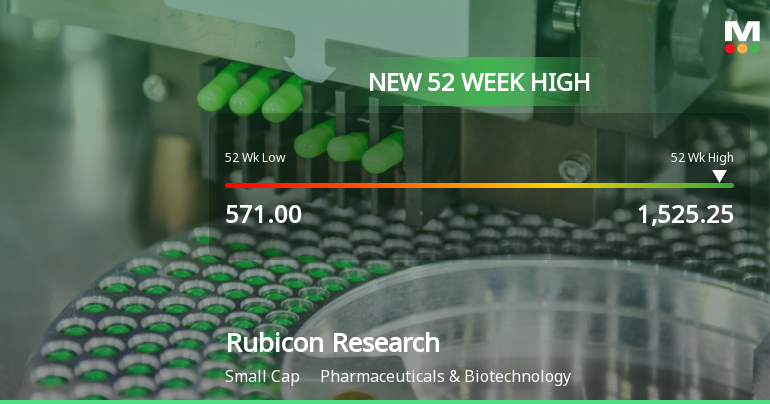
Broad-Based Technical Strength Lifts Rubicon Research Ltd to 52-Week High of Rs 1525.25
Surging to an intraday peak of Rs 1525.25 on 14 Jul 2026, Rubicon Research Ltd has reached a fresh 52-week and all-time high, propelled by a confluence of bullish technical indicators and sustained price momentum that outpaces its sector and broader market trends.
Read full news article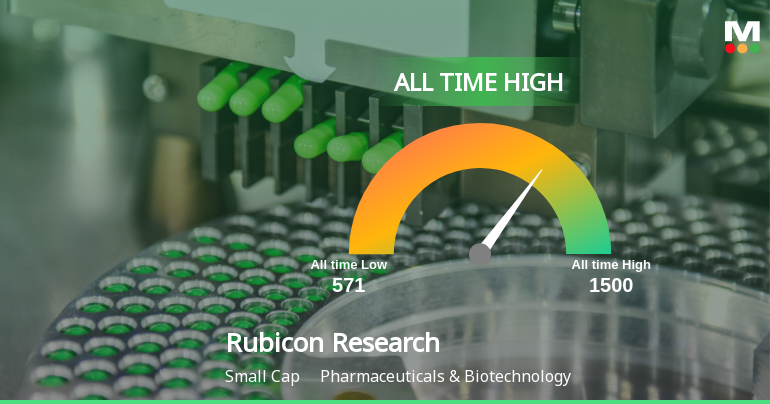
Announcements
Certificate Under Regulation 74(5) Of SEBI (Depositories And Participants) Regulations 2018 For The Quarter Ended June 30 2026.
09-Jul-2026 | Source : BSECertificate under regulation 74(5) of SEBI (Depositories and Participants) Regulations 2018 for the Quarter ended June 30 2026
Disclosure Under Regulation 30 Of SEBI (Listing Obligations And Disclosure Requirements) Regulations 2015 - US FDA Inspection Of The CompanyS Manufacturing Facility In Pithampur Madhya Pradesh
03-Jul-2026 | Source : BSEDisclosure under Regulation 30 of SEBI (Listing Obligations and Disclosure Requirements) Regulations 2015 - US FDA inspection of Companys manufacturing facility in Pithampur Madhya Pradesh.
Closure of Trading Window
29-Jun-2026 | Source : BSEIntimation of Closure of Trading Window
Corporate Actions

No Upcoming Board Meetings

No Dividend history available

No Splits history available

No Bonus history available

No Rights history available
Quality key factors
Valuation key factors
Technicals key factors
 Technical Indicator Scale: Bearish, Mildly Bearish, Sideways, Mildly Bullish, Bullish Turned
 Shareholding Snapshot : Mar 2026
Shareholding Compare (%holding)
Promoters
None
Held by 12 Schemes (7.14%)
Held by 28 FIIs (7.54%)
General Atlantic Singapore Rr Pte Ltd (35.89%)
Shivanand Shankar Mankekar Huf (13.54%)
2.82%
Quarterly Results Snapshot (Standalone) - Mar'26 - QoQ

QoQ Growth in quarter ended Mar 2026 is 29.22% vs -10.33% in Dec 2025
QoQ Growth in quarter ended Mar 2026 is 88.33% vs -18.84% in Dec 2025
Half Yearly Results Snapshot (Standalone) - Sep'25
Not Applicable: The company has declared_date for only one period
Not Applicable: The company has declared_date for only one period
Nine Monthly Results Snapshot (Standalone) - Dec'25
Not Applicable: The company has declared_date for only one period
Not Applicable: The company has declared_date for only one period
Annual Results Snapshot (Consolidated) - Mar'26

YoY Growth in year ended Mar 2026 is 36.57% vs 50.40% in Mar 2025
YoY Growth in year ended Mar 2026 is 83.64% vs 47.63% in Mar 2025
About Rubicon Research Ltd

Company Coordinates


