
Compare Orkla India with Similar Stocks
Total Returns (Price + Dividend) 
Orkla India for the last several years.
Risk Adjusted Returns v/s
Returns Beta

News

Orkla India Ltd Technical Momentum Shifts Amid Mildly Bearish Signals
Orkla India Ltd, a small-cap player in the FMCG sector, has recently exhibited a shift in its technical momentum, moving from a sideways trend to a mildly bearish stance. Key technical indicators such as the MACD and Dow Theory on the weekly chart signal caution, while the stock’s price performance continues to lag behind the broader Sensex benchmark. This article analyses the evolving technical landscape and what it means for investors considering Orkla India Ltd.
Read full news article
Orkla India Ltd is Rated Hold by MarketsMOJO
Orkla India Ltd is rated 'Hold' by MarketsMOJO, with this rating last updated on 20 May 2026. However, the analysis and financial metrics discussed here reflect the stock's current position as of 04 July 2026, providing investors with an up-to-date view of the company’s fundamentals, valuation, financial trends, and technical outlook.
Read full news article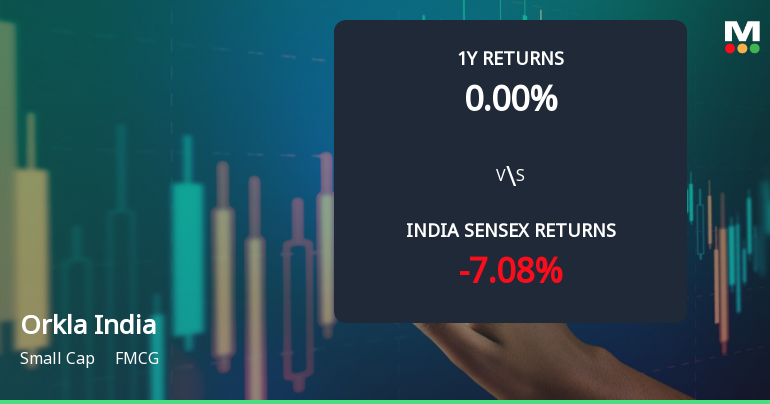
Orkla India Ltd Technical Momentum Shifts Amid Sideways Trend
Orkla India Ltd has exhibited a notable shift in its technical momentum, moving from a mildly bearish stance to a sideways trend, signalling a period of consolidation in the FMCG small-cap stock. Recent price action and technical indicators such as MACD, RSI, and Bollinger Bands suggest a nuanced outlook for investors navigating this evolving landscape.
Read full news article Announcements
Closure of Trading Window
22-Jun-2026 | Source : BSEIntimation regarding Closure of Trading Window
Outcome Of Board Meeting Held On June 09 2026
09-Jun-2026 | Source : BSEOutcome of Board Meeting held on June 09 2026
Compliances-Reg.24(A)-Annual Secretarial Compliance
27-May-2026 | Source : BSEAnnual Secretarial Compliance Report for the financial year ended March 31 2026
Corporate Actions

No Upcoming Board Meetings

No Dividend history available

No Splits history available

No Bonus history available

No Rights history available
Quality key factors
Valuation key factors
Technicals key factors
 Technical Indicator Scale: Bearish, Mildly Bearish, Sideways, Mildly Bullish, Bullish Turned
 Shareholding Snapshot : Mar 2026
Shareholding Compare (%holding)
Promoters
None
Held by 13 Schemes (8.45%)
Held by 27 FIIs (2.42%)
Orkla Asia Pacific Pte Ltd (75.0%)
Nippon Life India Trustee Ltd-a/c Nippon India Con (6.12%)
13.0%
Quarterly Results Snapshot (Standalone) - Mar'26 - QoQ

QoQ Growth in quarter ended Mar 2026 is -1.50% vs -2.16% in Dec 2025
QoQ Growth in quarter ended Mar 2026 is 33.03% vs -26.99% in Dec 2025
Half Yearly Results Snapshot (Standalone) - Sep'25
Not Applicable: The company has declared_date for only one period
Not Applicable: The company has declared_date for only one period
Nine Monthly Results Snapshot (Standalone) - Dec'25
Not Applicable: The company has declared_date for only one period
Not Applicable: The company has declared_date for only one period
Annual Results Snapshot (Standalone) - Mar'26
Not Applicable: The company has declared_date for only one period
Not Applicable: The company has declared_date for only one period
About Orkla India Ltd

Company Coordinates


