
Compare Orkla India with Similar Stocks
Total Returns (Price + Dividend) 
Orkla India for the last several years.
Risk Adjusted Returns v/s
Returns Beta

News

Orkla India Ltd is Rated Hold
Orkla India Ltd is rated 'Hold' by MarketsMOJO, with this rating last updated on 20 May 2026. However, the analysis and financial metrics discussed here reflect the stock's current position as of 15 July 2026, providing investors with an up-to-date view of the company’s fundamentals, valuation, financial trend, and technical outlook.
Read full news article
Orkla India Ltd Technical Momentum Shifts Amid Mildly Bearish Outlook
Orkla India Ltd, a small-cap player in the FMCG sector, has experienced a notable shift in its technical momentum, moving from a sideways trend to a mildly bearish stance. Recent technical indicators, including MACD, RSI, and Bollinger Bands, signal caution for investors as the stock price dips below key moving averages, reflecting a subdued market sentiment despite the company’s resilient fundamentals.
Read full news article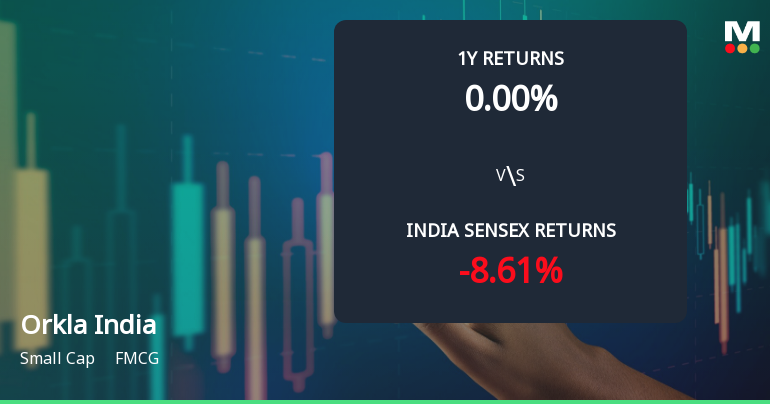
Orkla India Ltd Technical Momentum Shifts Amid Sideways Trend
Orkla India Ltd, a small-cap player in the FMCG sector, has witnessed a notable shift in its technical momentum, moving from a mildly bearish stance to a sideways trend. Despite a modest day decline of 0.90%, the stock’s technical indicators reveal a complex picture that investors should carefully analyse amid broader market dynamics.
Read full news article Announcements
Announcement under Regulation 30 (LODR)-Press Release / Media Release
17-Jul-2026 | Source : BSEPress Release
Compliances-Certificate under Reg. 74 (5) of SEBI (DP) Regulations 2018
10-Jul-2026 | Source : BSECertificate under Regulation 74(5) of SEBI (Depositories and Participants) Regulations 2018 for the quarter ended June 30 2026
Closure of Trading Window
22-Jun-2026 | Source : BSEIntimation regarding Closure of Trading Window
Corporate Actions

No Upcoming Board Meetings

No Dividend history available

No Splits history available

No Bonus history available

No Rights history available
Quality key factors
Valuation key factors
Technicals key factors
 Technical Indicator Scale: Bearish, Mildly Bearish, Sideways, Mildly Bullish, Bullish Turned
 Shareholding Snapshot : Mar 2026
Shareholding Compare (%holding)
Promoters
None
Held by 13 Schemes (8.45%)
Held by 27 FIIs (2.42%)
Orkla Asia Pacific Pte Ltd (75.0%)
Nippon Life India Trustee Ltd-a/c Nippon India Con (6.12%)
13.0%
Quarterly Results Snapshot (Standalone) - Mar'26 - QoQ

QoQ Growth in quarter ended Mar 2026 is -1.50% vs -2.16% in Dec 2025
QoQ Growth in quarter ended Mar 2026 is 33.03% vs -26.99% in Dec 2025
Half Yearly Results Snapshot (Standalone) - Sep'25
Not Applicable: The company has declared_date for only one period
Not Applicable: The company has declared_date for only one period
Nine Monthly Results Snapshot (Standalone) - Dec'25
Not Applicable: The company has declared_date for only one period
Not Applicable: The company has declared_date for only one period
Annual Results Snapshot (Standalone) - Mar'26
Not Applicable: The company has declared_date for only one period
Not Applicable: The company has declared_date for only one period
About Orkla India Ltd

Company Coordinates


