
Compare Capillary Tech. with Similar Stocks
Dashboard
Poor Management Efficiency with a low ROE of 0%
- The company has reported losses. Due to this company has reported negative ROE
The company is Net-Debt Free
Healthy long term growth as Net Sales has grown by an annual rate of 0%
With ROE of 2.7, it has a Very Expensive valuation with a 3.9 Price to Book Value
High Institutional Holdings at 22.03%
Stock DNA
Computers - Software & Consulting
INR 3,955 Cr (Small Cap)
100.00
20
0.00%
-0.42
2.68%
3.85
Total Returns (Price + Dividend) 
Capillary Tech. for the last several years.
Risk Adjusted Returns v/s
Returns Beta

News

Capillary Technologies India Ltd is Rated Hold
Capillary Technologies India Ltd is rated 'Hold' by MarketsMOJO, with this rating last updated on 15 June 2026. However, the analysis and financial metrics discussed here reflect the stock's current position as of 20 June 2026, providing investors with an up-to-date view of the company’s fundamentals, valuation, financial trends, and technical outlook.
Read full news article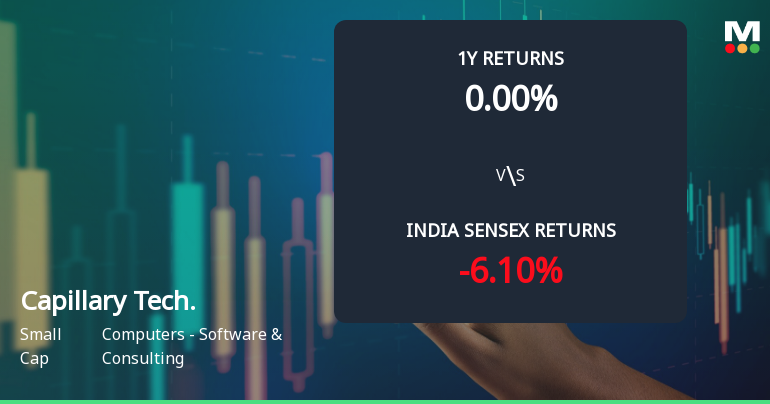
Capillary Technologies India Ltd Faces Technical Momentum Shift Amid Market Challenges
Capillary Technologies India Ltd, a small-cap player in the Computers - Software & Consulting sector, has experienced a notable shift in its technical momentum, moving from a mildly bullish stance to a sideways trend. This change comes amid a challenging market environment where the stock has underperformed the broader Sensex index over recent periods, prompting a reassessment of its technical indicators and investment outlook.
Read full news article
Capillary Technologies India Ltd Technical Momentum Shifts to Mildly Bullish Amid Market Challenges
Capillary Technologies India Ltd has experienced a notable shift in its technical momentum, moving from a mildly bearish to a mildly bullish trend, despite recent price declines and underperformance relative to the Sensex. This article analyses the key technical indicators, price action, and comparative returns to provide a comprehensive view of the stock’s current market positioning.
Read full news article Announcements
Intimation Under Regulation 30 Of Securities And Exchange Board Of India (Listing Obligations And Disclosure Requirements) Regulations 2015 (The Listing Regulations) - Participation In Investor Conference
10-Jun-2026 | Source : BSEWe wish to inform you that the Company through its representative will be participating in the investor conference.
Intimation Of Fixation Of Date Of 14Th Annual General Meeting (AGM) Of The Capillary Technologies India Limited
29-May-2026 | Source : BSEWe wish to inform you that Board of Directors in its meetng held today has approved tp hold the 14th AGM of the Company on Friday August 28 2026.
Announcement under Regulation 30 (LODR)-Change in Management
29-May-2026 | Source : BSEResignation of Mr. Ravi Jaswani Head - Finance designated as SMP of the Company
Corporate Actions

No Upcoming Board Meetings

No Dividend history available

No Splits history available

No Bonus history available

No Rights history available
Quality key factors
Valuation key factors
Technicals key factors
 Technical Indicator Scale: Bearish, Mildly Bearish, Sideways, Mildly Bullish, Bullish Turned
 Shareholding Snapshot : Mar 2026
Shareholding Compare (%holding)
Promoters
None
Held by 13 Schemes (14.02%)
Held by 20 FIIs (3.43%)
Capillary Technologies International Pte Ltd (49.7%)
Ronal Holdings Llc (6.96%)
4.72%
Quarterly Results Snapshot (Standalone) - Mar'26 - QoQ

QoQ Growth in quarter ended Mar 2026 is 12.14% vs 24.53% in Dec 2025

QoQ Growth in quarter ended Mar 2026 is 842.86% vs 135.71% in Dec 2025
Half Yearly Results Snapshot (Consolidated) - Sep'25
Not Applicable: The company has declared_date for only one period
Not Applicable: The company has declared_date for only one period
Nine Monthly Results Snapshot (Consolidated) - Dec'25
Not Applicable: The company has declared_date for only one period
Not Applicable: The company has declared_date for only one period
Annual Results Snapshot (Consolidated) - Mar'26
YoY Growth in year ended Mar 2026 is 22.79% vs 13.93% in Mar 2025
YoY Growth in year ended Mar 2026 is 294.50% vs 122.36% in Mar 2025
About Capillary Technologies India Ltd

Company Coordinates


