
Compare Capillary Tech. with Similar Stocks
Dashboard
Poor Management Efficiency with a low ROE of 0%
- The company has reported losses. Due to this company has reported negative ROE
The company is Net-Debt Free
Healthy long term growth as Net Sales has grown by an annual rate of 0%
With ROE of 2.7, it has a Very Expensive valuation with a 3.8 Price to Book Value
High Institutional Holdings at 22.03%
Stock DNA
Computers - Software & Consulting
INR 3,904 Cr (Small Cap)
98.00
20
0.00%
-0.42
2.68%
3.82
Total Returns (Price + Dividend) 
Capillary Tech. for the last several years.
Risk Adjusted Returns v/s
Returns Beta

News

Capillary Technologies India Ltd Technical Momentum Shifts Amid Sideways Trend
Capillary Technologies India Ltd has experienced a notable shift in its technical momentum, moving from a mildly bullish stance to a sideways trend, reflecting a period of consolidation after recent price fluctuations. Despite a modest day change of 0.24%, the stock’s technical indicators reveal a complex picture that investors should carefully analyse amid broader market pressures and sector dynamics.
Read full news article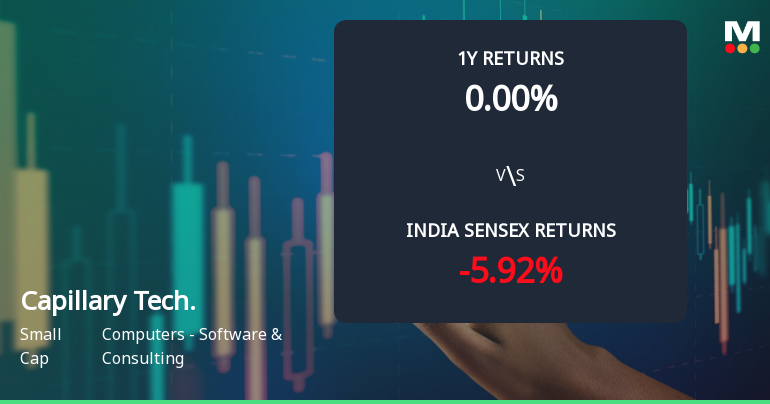
Capillary Technologies India Ltd Shows Mildly Bullish Momentum Amid Technical Shift
Capillary Technologies India Ltd, a small-cap player in the Computers - Software & Consulting sector, has recently exhibited a shift in its technical momentum, moving from a sideways trend to a mildly bullish stance. This change is underscored by nuanced signals from key technical indicators such as the MACD, RSI, and moving averages, suggesting a cautiously optimistic outlook for investors despite the stock’s recent underperformance relative to the broader market.
Read full news article
Capillary Technologies India Ltd Downgraded to Sell Amid Technical and Financial Concerns
Capillary Technologies India Ltd has seen its investment rating downgraded from Hold to Sell, reflecting a combination of deteriorating technical indicators, expensive valuation metrics, and disappointing financial trends. Despite some operational strengths, the company’s overall outlook has weakened, prompting a reassessment of its investment appeal.
Read full news article Announcements
Announcement under Regulation 30 (LODR)-Analyst / Investor Meet - Intimation
11-Jul-2026 | Source : BSEIntimation of schedule of Investors Meeting.
Compliances-Certificate under Reg. 74 (5) of SEBI (DP) Regulations 2018
09-Jul-2026 | Source : BSECompliance certificate under Regulation 74 (5) of SEBI (DP) Regulations 2018 for the quarter ended June 30 2026
Disclosure Under Regulation 30 Read With Schedule III Of The Securities And Exchange Board Of India (Listing Obligations And Disclosure Requirements) Regulations 2015
06-Jul-2026 | Source : BSEThis is to inform that one of the Companys recently acquired overseas step-down subsidiary has been affected by a cyber-enabled banking fraud.
Corporate Actions

No Upcoming Board Meetings

No Dividend history available

No Splits history available

No Bonus history available

No Rights history available
Quality key factors
Valuation key factors
Technicals key factors
 Technical Indicator Scale: Bearish, Mildly Bearish, Sideways, Mildly Bullish, Bullish Turned
 Shareholding Snapshot : Mar 2026
Shareholding Compare (%holding)
Promoters
None
Held by 13 Schemes (14.02%)
Held by 20 FIIs (3.43%)
Capillary Technologies International Pte Ltd (49.7%)
Ronal Holdings Llc (6.96%)
4.72%
Quarterly Results Snapshot (Standalone) - Mar'26 - QoQ

QoQ Growth in quarter ended Mar 2026 is 12.14% vs 24.53% in Dec 2025

QoQ Growth in quarter ended Mar 2026 is 842.86% vs 135.71% in Dec 2025
Half Yearly Results Snapshot (Consolidated) - Sep'25
Not Applicable: The company has declared_date for only one period
Not Applicable: The company has declared_date for only one period
Nine Monthly Results Snapshot (Consolidated) - Dec'25
Not Applicable: The company has declared_date for only one period
Not Applicable: The company has declared_date for only one period
Annual Results Snapshot (Consolidated) - Mar'26
YoY Growth in year ended Mar 2026 is 22.79% vs 13.93% in Mar 2025
YoY Growth in year ended Mar 2026 is 294.50% vs 122.36% in Mar 2025
About Capillary Technologies India Ltd

Company Coordinates


