
Compare KSH Internationa with Similar Stocks
Stock DNA
Industrial Products
INR 6,211 Cr (Small Cap)
54.00
39
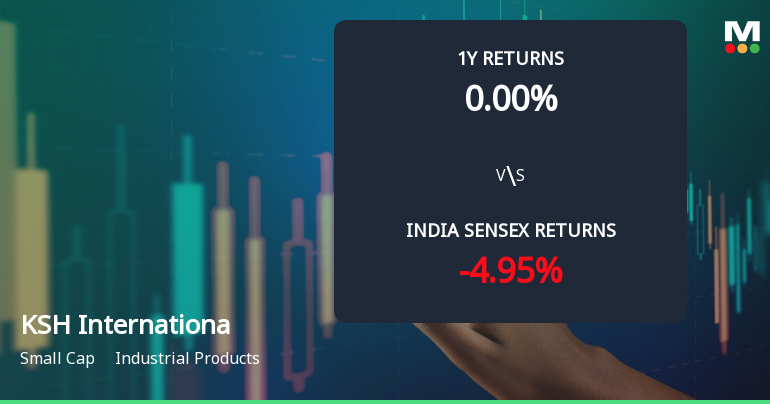
0.00%
1.37
31.78%
17.27
Total Returns (Price + Dividend) 
KSH Internationa for the last several years.
Risk Adjusted Returns v/s
Returns Beta

News
KSH International Ltd Sees Technical Momentum Shift Amid Strong Year-to-Date Gains
KSH International Ltd, a small-cap player in the Industrial Products sector, has experienced a notable shift in its technical momentum, moving from a bullish to a mildly bullish trend. This transition is underscored by a series of mixed yet promising technical indicators, including MACD, RSI, and moving averages, which collectively suggest a cautiously optimistic outlook for the stock’s near-term performance.
Read full news article
KSH International Ltd Upgraded to Buy on Strong Technical and Financial Performance
KSH International Ltd, a small-cap player in the industrial products sector, has seen its investment rating upgraded from Hold to Buy, reflecting significant improvements across technical indicators, financial trends, valuation metrics, and overall quality. This upgrade, announced on 17 July 2026, follows a robust quarter and a marked shift in market sentiment, positioning the stock favourably amid a challenging market backdrop.
Read full news article
KSH International Ltd Technical Momentum Shifts Signal Bullish Outlook
KSH International Ltd, a small-cap player in the industrial products sector, has witnessed a notable shift in its technical momentum, upgrading its MarketsMOJO grade from Hold to Buy as of 17 Jul 2026. Despite a recent day decline of 4.59%, the stock’s underlying technical indicators suggest a strengthening bullish trend, supported by robust weekly and monthly signals that could attract renewed investor interest.
Read full news article Announcements
Disclosures under Reg. 29(2) of SEBI (SAST) Regulations 2011
16-Jul-2026 | Source : BSEThe Exchange has received the disclosure under Regulation 29(2) of SEBI (Substantial Acquisition of Shares & Takeovers) Regulations 2011 for Kotak Mahindra Mutual Fund
Announcement under Regulation 30 (LODR)-Analyst / Investor Meet - Intimation
13-Jul-2026 | Source : BSEKSH International Limited has informed the Exchange regarding schedule of multiple one-on-one meetings with Analysts/investors.
Shareholder Meeting / Postal Ballot-Scrutinizers Report
06-Jul-2026 | Source : BSEKSH International Limited has submitted to the Exchange a copy of Scrutinizers Report of Postal Ballot. Further the Company has informed the Exchange regarding voting results.
Corporate Actions

No Upcoming Board Meetings

No Dividend history available

No Splits history available

No Bonus history available

No Rights history available
Quality key factors
Valuation key factors
Technicals key factors
 Technical Indicator Scale: Bearish, Mildly Bearish, Sideways, Mildly Bullish, Bullish Turned
 Shareholding Snapshot : Jun 2026
Shareholding Compare (%holding)
Promoters
None
Held by 7 Schemes (8.84%)
Held by 15 FIIs (5.71%)
Kushal Subbayya Hegde (35.23%)
Kotak Mahindra Trustee Co Ltd A/c Kotak Multi Asset Allocation Fund (3.73%)
6.84%
Quarterly Results Snapshot (Standalone) - Mar'26 - QoQ

QoQ Growth in quarter ended Mar 2026 is 24.53% vs 14.83% in Dec 2025
QoQ Growth in quarter ended Mar 2026 is 48.01% vs -21.16% in Dec 2025
Half Yearly Results Snapshot (Standalone) - Sep'25
Not Applicable: The company has declared_date for only one period
Not Applicable: The company has declared_date for only one period
Nine Monthly Results Snapshot (Standalone) - Dec'25
Not Applicable: The company has declared_date for only one period
Not Applicable: The company has declared_date for only one period
Annual Results Snapshot (Standalone) - Mar'26
YoY Growth in year ended Mar 2026 is 61.13% vs 39.45% in Mar 2025

YoY Growth in year ended Mar 2026 is 61.98% vs 82.03% in Mar 2025
About KSH International Ltd

Company Coordinates


