
Compare SKF India with Similar Stocks
Dashboard
High Management Efficiency with a high ROE of 21.65%
The company is Net-Debt Free
Poor long term growth as Operating profit has grown by an annual rate -7.15% of over the last 5 years
With a fall in Net Sales of -45.73%, the company declared Very Negative results in Mar 26
With ROE of 22.5, it has a Attractive valuation with a 6.2 Price to Book Value
High Institutional Holdings at 34.11%
Stock DNA
Industrial Products
INR 8,256 Cr (Small Cap)
27.00
52
0.92%
-0.22
22.55%
6.11
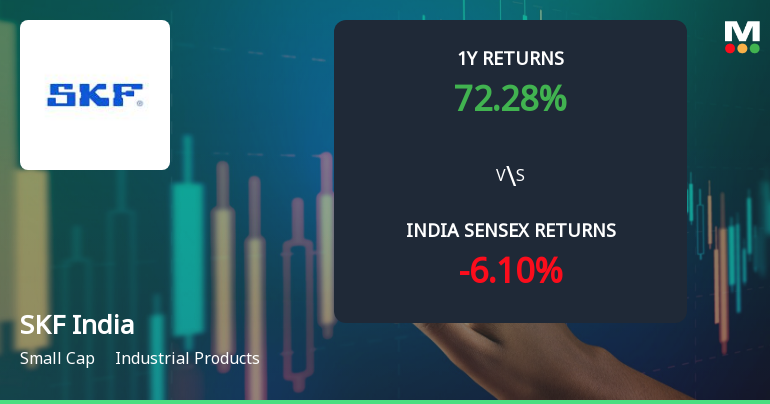
Total Returns (Price + Dividend) 
Latest dividend: 2.9886820000000003 per share ex-dividend date: Jul-04-2025
Risk Adjusted Returns v/s
Returns Beta

News
SKF India Ltd Technical Momentum Shifts Amid Mixed Indicator Signals
SKF India Ltd has experienced a nuanced shift in its technical momentum, moving from a bullish to a mildly bullish stance as of mid-June 2026. Despite a slight dip in daily price, the stock’s technical indicators present a complex picture, with mixed signals from MACD, RSI, moving averages, and other momentum oscillators. This analysis explores the evolving technical landscape of SKF India, contextualising its recent price action and longer-term trends against broader market benchmarks.
Read full news article
SKF India Ltd Technical Momentum Shifts Signal Bullish Outlook Amid Market Volatility
SKF India Ltd has demonstrated a notable shift in technical momentum, moving from a mildly bullish stance to a more confident bullish trend. This transition is underscored by a combination of key technical indicators, including MACD, RSI, moving averages, and Bollinger Bands, signalling a potential uptrend despite recent market volatility. Investors and analysts are closely monitoring these developments as the stock attempts to regain momentum within the industrial products sector.
Read full news article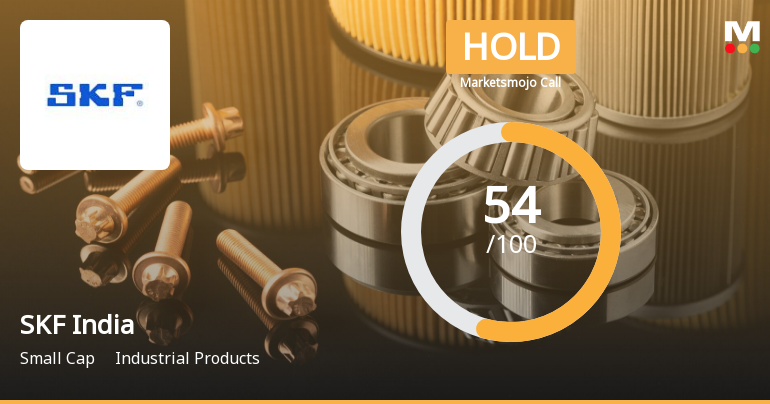
SKF India Ltd is Rated Hold by MarketsMOJO
SKF India Ltd is rated Hold by MarketsMOJO, with this rating last updated on 01 Oct 2025. However, the analysis and financial metrics discussed here reflect the company’s current position as of 13 June 2026, providing investors with an up-to-date perspective on the stock’s fundamentals, valuation, financial trends, and technical outlook.
Read full news article Announcements
Announcement under Regulation 30 (LODR)-Newspaper Publication
18-Jun-2026 | Source : BSEIn compliance with Regulation 30 of SEBI (LODR) Regulation 2015 we wish to inform you that the company has published a Newspaper Advertisement titled Notice with respect to Special Window for Re-Lodgment of transfer requests of physical shares in Financial Express and Loksatta.
Clarification To Query Raised By NSE With Respect To Limited Review Report/ Independent Auditors Report For Consolidated Annual Financial Results For The Quarter And Year Ended 31St March 2026
03-Jun-2026 | Source : BSEWe wish to inform you that there was an inadvertent typographical error in the date mentioned as 12th May 2026 in the previously submitted Consolidated Audit Report. The correct date of signing should be read as 13th May 2026 as duly evidenced by UDIN generated for the report. The company has submitted the same with NSE also on NEAPS portal.
Announcement under Regulation 30 (LODR)-Earnings Call Transcript
26-May-2026 | Source : BSEWe are enclosing herewith the Transcript of Analyst / Institutional Investor meeting held on Thursday 21st May 2026 at 11:00 AM.
Corporate Actions

No Upcoming Board Meetings

SKF India Ltd has declared 400% dividend, ex-date: 03 Jul 26

No Splits history available

No Bonus history available

No Rights history available
Quality key factors
Valuation key factors
Technicals key factors
 Technical Indicator Scale: Bearish, Mildly Bearish, Sideways, Mildly Bullish, Bullish Turned
 Shareholding Snapshot : Mar 2026
Shareholding Compare (%holding)
Promoters
None
Held by 17 Schemes (24.06%)
Held by 136 FIIs (7.1%)
Skf Interim Ab (52.58%)
Hdfc Mutual Fund - Hdfc Mid-cap Fund (9.71%)
10.12%
Quarterly Results Snapshot (Consolidated) - Mar'26 - QoQ

QoQ Growth in quarter ended Mar 2026 is 3.10% vs -55.95% in Dec 2025

QoQ Growth in quarter ended Mar 2026 is -131.87% vs -41.23% in Dec 2025
Half Yearly Results Snapshot (Consolidated) - Sep'25
Growth in half year ended Sep 2025 is 5.79% vs 7.72% in Sep 2024
Growth in half year ended Sep 2025 is -11.62% vs 3.57% in Sep 2024
Nine Monthly Results Snapshot (Consolidated) - Dec'25
YoY Growth in nine months ended Dec 2025 is -14.51% vs 10.09% in Dec 2024
YoY Growth in nine months ended Dec 2025 is -21.21% vs -3.70% in Dec 2024
Annual Results Snapshot (Consolidated) - Mar'26
YoY Growth in year ended Mar 2026 is -23.51% vs 7.65% in Mar 2025
YoY Growth in year ended Mar 2026 is -53.01% vs 2.56% in Mar 2025
About SKF India Ltd

Company Coordinates


