
Compare Ircon Intl. with Similar Stocks
Stock DNA
Construction
INR 13,073 Cr (Small Cap)
22.00
37
1.60%
0.08
8.97%
1.95
Total Returns (Price + Dividend) 
Latest dividend: 1.1968514266972778 per share ex-dividend date: Feb-17-2026
Risk Adjusted Returns v/s
Returns Beta

News

Ircon International Ltd is Rated Sell
Ircon International Ltd is rated 'Sell' by MarketsMOJO, with this rating last updated on 22 May 2026. However, the analysis and financial metrics discussed here reflect the stock's current position as of 20 June 2026, providing investors with the latest insights into the company’s performance and outlook.
Read full news article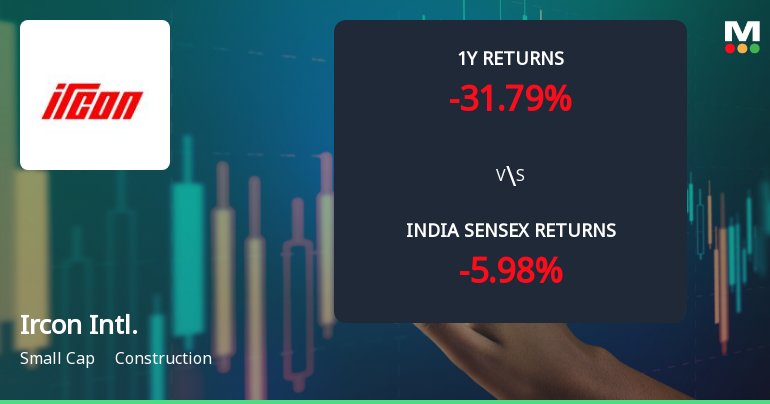
Ircon International Ltd Technical Momentum Shifts Amid Mixed Market Signals
Ircon International Ltd has exhibited a nuanced shift in its technical momentum, moving from a bearish stance to a mildly bearish outlook, reflecting a complex interplay of technical indicators. Despite a modest 2.03% gain on 16 Jun 2026, the stock’s broader trend remains cautious, with mixed signals from MACD, RSI, moving averages, and other momentum oscillators shaping investor sentiment in the construction sector.
Read full news article
Ircon International Ltd Technical Analysis: Momentum Shifts Signal Bearish Outlook
Ircon International Ltd, a small-cap player in the construction sector, has experienced a notable shift in its technical momentum, moving from a mildly bearish stance to a more pronounced bearish trend. Despite some mildly bullish signals on weekly MACD and KST indicators, the overall technical landscape remains challenging, with key moving averages and Bollinger Bands signalling downward pressure. This article analyses the recent technical parameter changes, price momentum, and the implications for investors amid a broader market context.
Read full news article Announcements
Announcement under Regulation 30 (LODR)-Newspaper Publication
09-Jun-2026 | Source : BSEPublic Notice to Shareholders regarding special Window for transfer & dematerialization of physical securities of Ircon International Limited.
Announcement under Regulation 30 (LODR)-Newspaper Publication
09-Jun-2026 | Source : BSENewspaper Publication- Public Notice to the Shareholders for Transfer of Unpaid Dividends/ Equity Shares of the Company to IEPF Authority.
Compliances-Reg.24(A)-Annual Secretarial Compliance
27-May-2026 | Source : BSEAnnual Secretarial Compliance Report for the Financial Year 2025-26
Corporate Actions

No Upcoming Board Meetings

Ircon International Ltd has declared 60% dividend, ex-date: 17 Feb 26

Ircon International Ltd has announced 2:10 stock split, ex-date: 03 Apr 20

Ircon International Ltd has announced 1:1 bonus issue, ex-date: 20 May 21

No Rights history available
Quality key factors
Valuation key factors
Technicals key factors
 Technical Indicator Scale: Bearish, Mildly Bearish, Sideways, Mildly Bullish, Bullish Turned
 Shareholding Snapshot : Mar 2026
Shareholding Compare (%holding)
Promoters
None
Held by 17 Schemes (0.29%)
Held by 109 FIIs (4.78%)
The President Of India(through Chairman Railway Board) (65.17%)
None
25.82%
Quarterly Results Snapshot (Consolidated) - Mar'26 - YoY

YoY Growth in quarter ended Mar 2026 is -6.54% vs -9.90% in Mar 2025
YoY Growth in quarter ended Mar 2026 is -9.13% vs -14.58% in Mar 2025
Half Yearly Results Snapshot (Consolidated) - Sep'25

Growth in half year ended Sep 2025 is -20.52% vs -16.99% in Sep 2024
Growth in half year ended Sep 2025 is -29.48% vs -1.85% in Sep 2024
Nine Monthly Results Snapshot (Consolidated) - Dec'25
YoY Growth in nine months ended Dec 2025 is -19.94% vs -14.90% in Dec 2024
YoY Growth in nine months ended Dec 2025 is -21.82% vs -24.34% in Dec 2024
Annual Results Snapshot (Consolidated) - Mar'26
YoY Growth in year ended Mar 2026 is -15.69% vs -14.02% in Mar 2025
YoY Growth in year ended Mar 2026 is -18.14% vs -21.75% in Mar 2025
About Ircon International Ltd

Company Coordinates


