
Compare Vertis Infra. with Similar Stocks
Dashboard
Low ability to service debt as the company has a high Debt to EBITDA ratio of 4.10 times
- Low ability to service debt as the company has a high Debt to EBITDA ratio of 4.10 times
- The company has been able to generate a Return on Equity (avg) of 8.07% signifying low profitability per unit of shareholders funds
With ROCE of 9.8, it has a Very Expensive valuation with a 1.6 Enterprise value to Capital Employed
Stock DNA
Construction
INR 16,444 Cr (Small Cap)
23.00
32
10.10%
1.58
11.08%
2.56
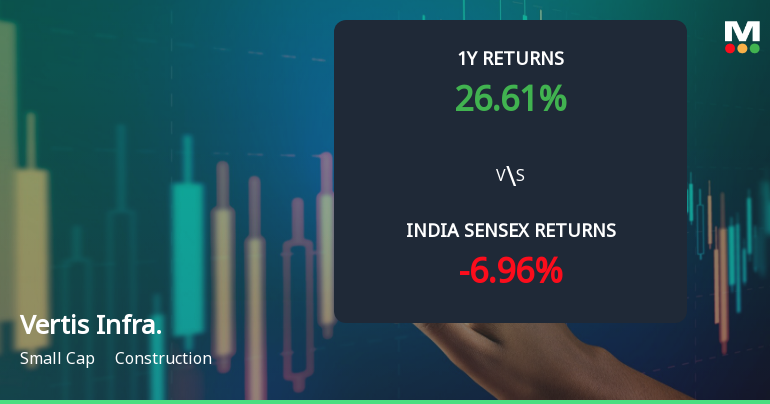
Total Returns (Price + Dividend) 
Latest dividend: 3.0000000000000004 per share ex-dividend date: May-22-2026
Risk Adjusted Returns v/s
Returns Beta

News
Vertis Infrastructure Trust Shows Mildly Bullish Momentum Amid Mixed Technical Signals
Vertis Infrastructure Trust has experienced a subtle shift in its technical momentum, moving from a sideways trend to a mildly bullish stance. Despite this positive directional change, a detailed analysis of key technical indicators such as MACD, RSI, and moving averages reveals a complex picture that investors should carefully consider before making decisions.
Read full news article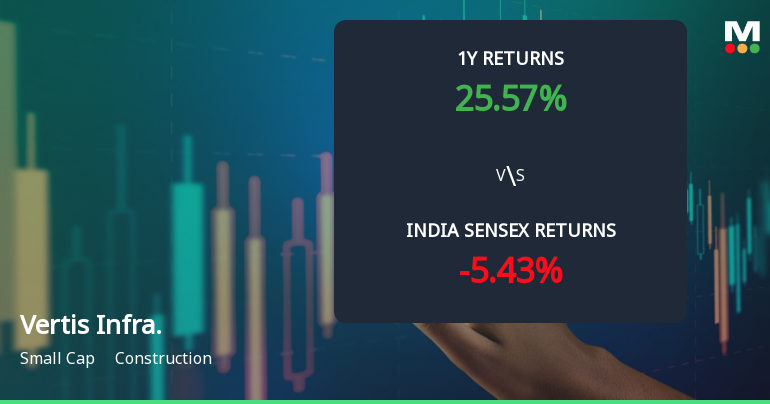
Vertis Infrastructure Trust Technical Momentum Shifts Amid Sideways Trend
Vertis Infrastructure Trust, a small-cap player in the construction sector, has experienced a notable shift in its technical momentum, transitioning from a mildly bullish stance to a sideways trend. Despite a stable price at ₹108.00, technical indicators such as MACD, RSI, and moving averages reveal a nuanced picture of the stock’s near-term outlook, prompting a reassessment of its market positioning and investor sentiment.
Read full news article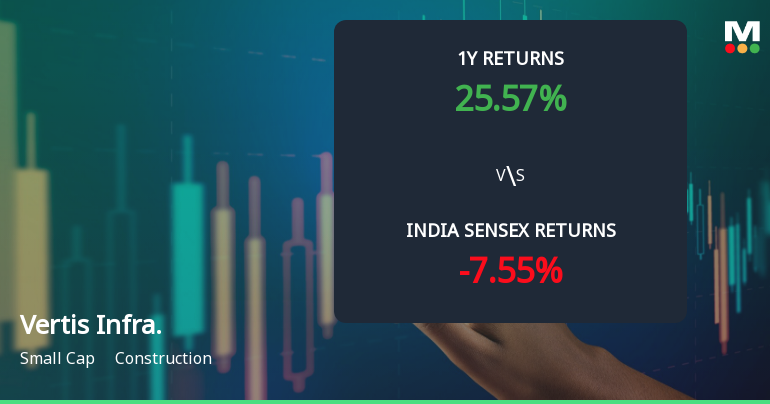
Vertis Infrastructure Trust Shows Technical Momentum Shift Amid Mixed Market Signals
Vertis Infrastructure Trust has experienced a subtle shift in price momentum, moving from a mildly bearish to a mildly bullish technical trend. Despite a recent downgrade in its Mojo Grade from Hold to Sell, the stock’s daily moving averages and Bollinger Bands suggest cautious optimism, while other indicators such as MACD and RSI present a more nuanced picture for investors navigating the construction sector.
Read full news article Announcements
Corporate Actions

No Upcoming Board Meetings

Vertis Infrastructure Trust has declared 3% dividend, ex-date: 22 May 26

No Splits history available

No Bonus history available

No Rights history available
Quality key factors
Valuation key factors
Technicals key factors
 Technical Indicator Scale: Bearish, Mildly Bearish, Sideways, Mildly Bullish, Bullish Turned
 Shareholding Snapshot : Mar 2026
Shareholding Compare (%holding)
Promoters
19.8031
Held by 0 Schemes (1.67%)
Held by 0 FIIs (0.01%)
Nebula Asia Holdings II Pte Ltd (43.81%)
2452991 Ontario Limited (21.75%)
4.34%
Quarterly Results Snapshot (Consolidated) - Mar'26 - QoQ

QoQ Growth in quarter ended Mar 2026 is 3.88% vs 1.44% in Dec 2025
QoQ Growth in quarter ended Mar 2026 is 123.72% vs -51.40% in Dec 2025
Half Yearly Results Snapshot (Consolidated) - Sep'25
Growth in half year ended Sep 2025 is 76.87% vs -6.72% in Sep 2024

Growth in half year ended Sep 2025 is 42.35% vs 172.81% in Sep 2024
Nine Monthly Results Snapshot (Consolidated) - Dec'25
YoY Growth in nine months ended Dec 2025 is 85.27% vs 102.68% in Dec 2024
YoY Growth in nine months ended Dec 2025 is 30.22% vs 109.36% in Dec 2024
Annual Results Snapshot (Consolidated) - Mar'26
YoY Growth in year ended Mar 2026 is 75.85% vs 7.74% in Mar 2025
YoY Growth in year ended Mar 2026 is 34.95% vs 391.46% in Mar 2025
About Vertis Infrastructure Trust

Company Coordinates


